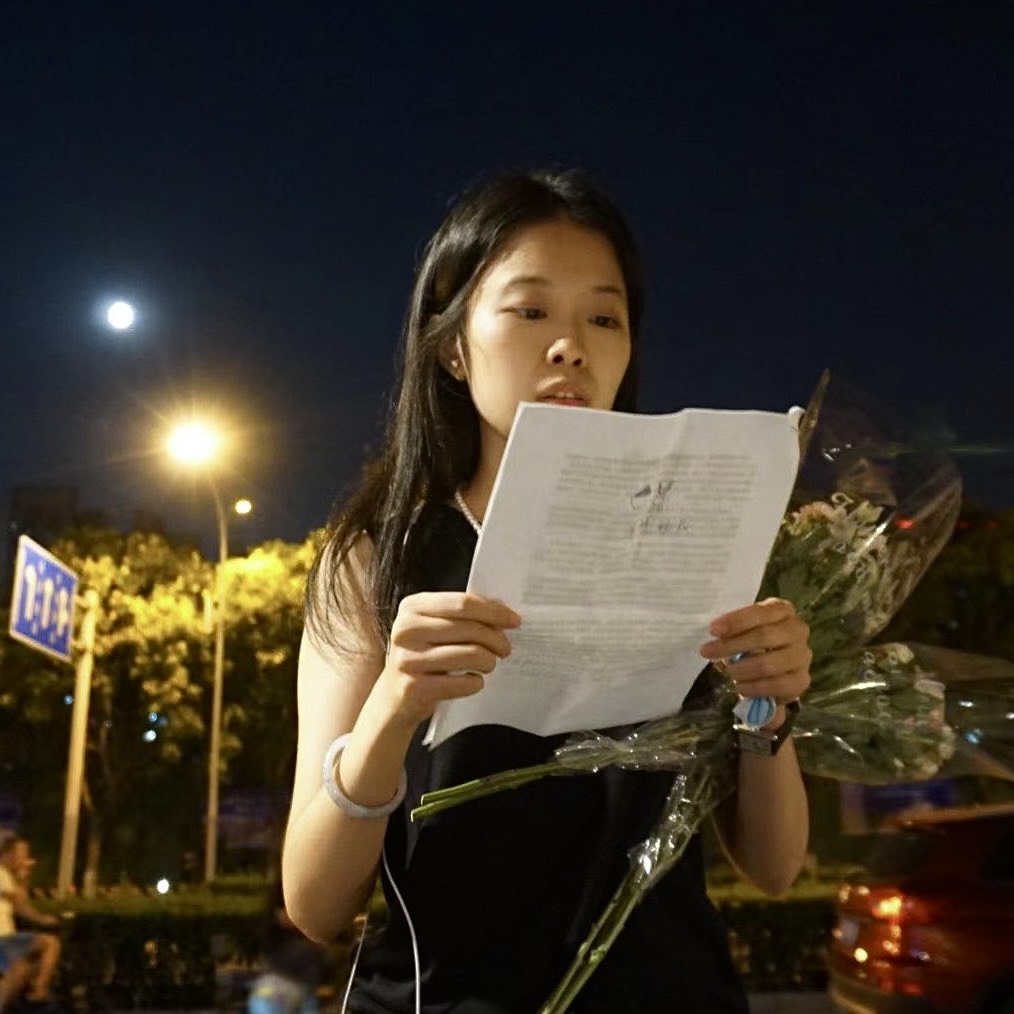
Hi, I'm Eve (Yi) Lu✨
I'm a data journalist and information designer. I tell stories with data📊, create graphics🎨 and sometimes make films📹.
About
My work has appeared in Scientific American where I created delightful visuals and wrote about fun science, and the Tampa Bay Times where I was a data reporter intern. I covered gender inequality, public health, the environment, and technology. I'm also a Stanford alumna in Data Journalism. Prior to Stanford, I hold a master's degree in Journalism at the University of Miami and a Lede Program alumna. Born and raised in Shanghai, I speak English and Mandarin. While not coding or writing, I watch thriller movies alone 🍿 and collect Hello Kittys 🎀₍^. .^₎⟆.
Tools I use


DATA STORY
I make graphics
Does Your City Make You Healthier?
March 2026 • Scientific American
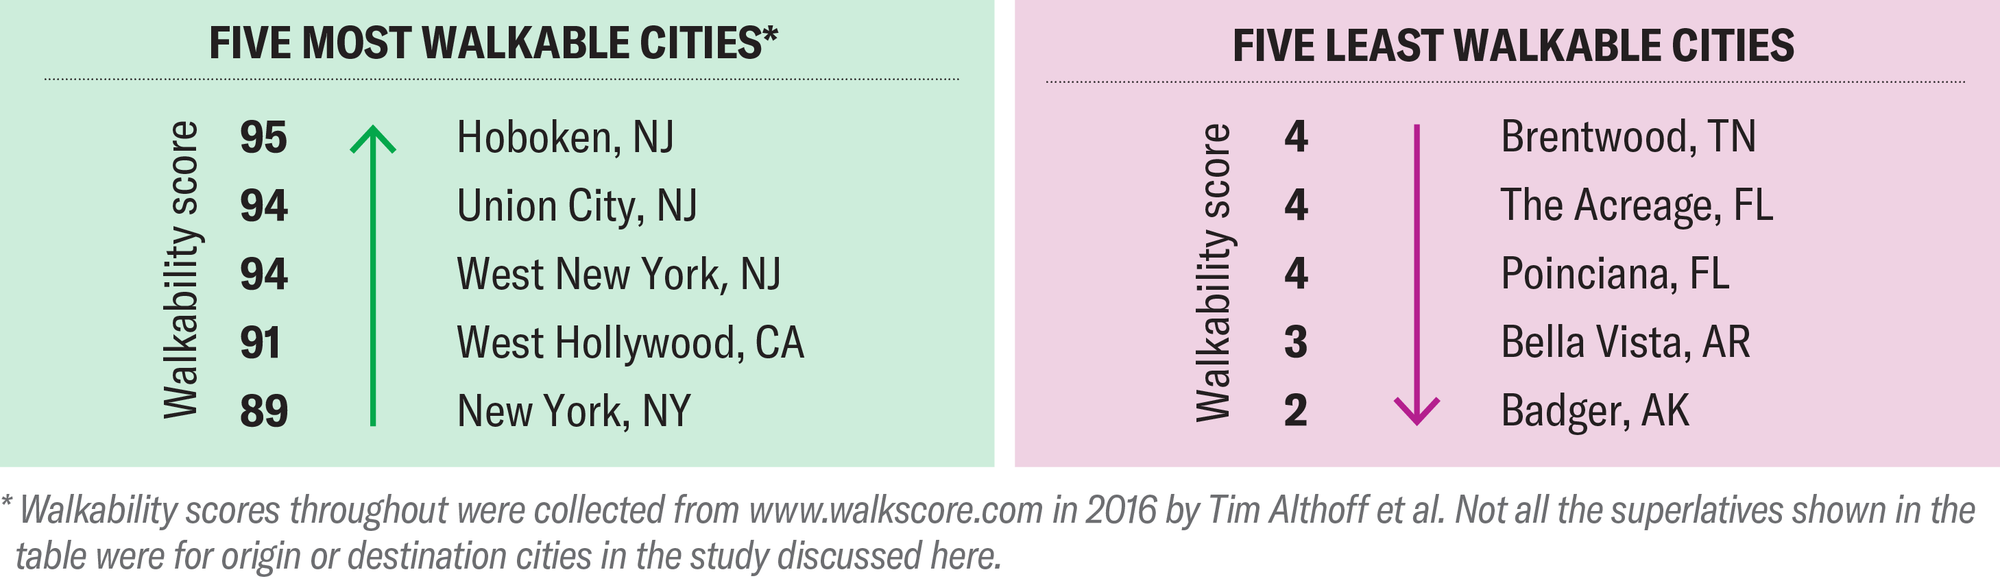
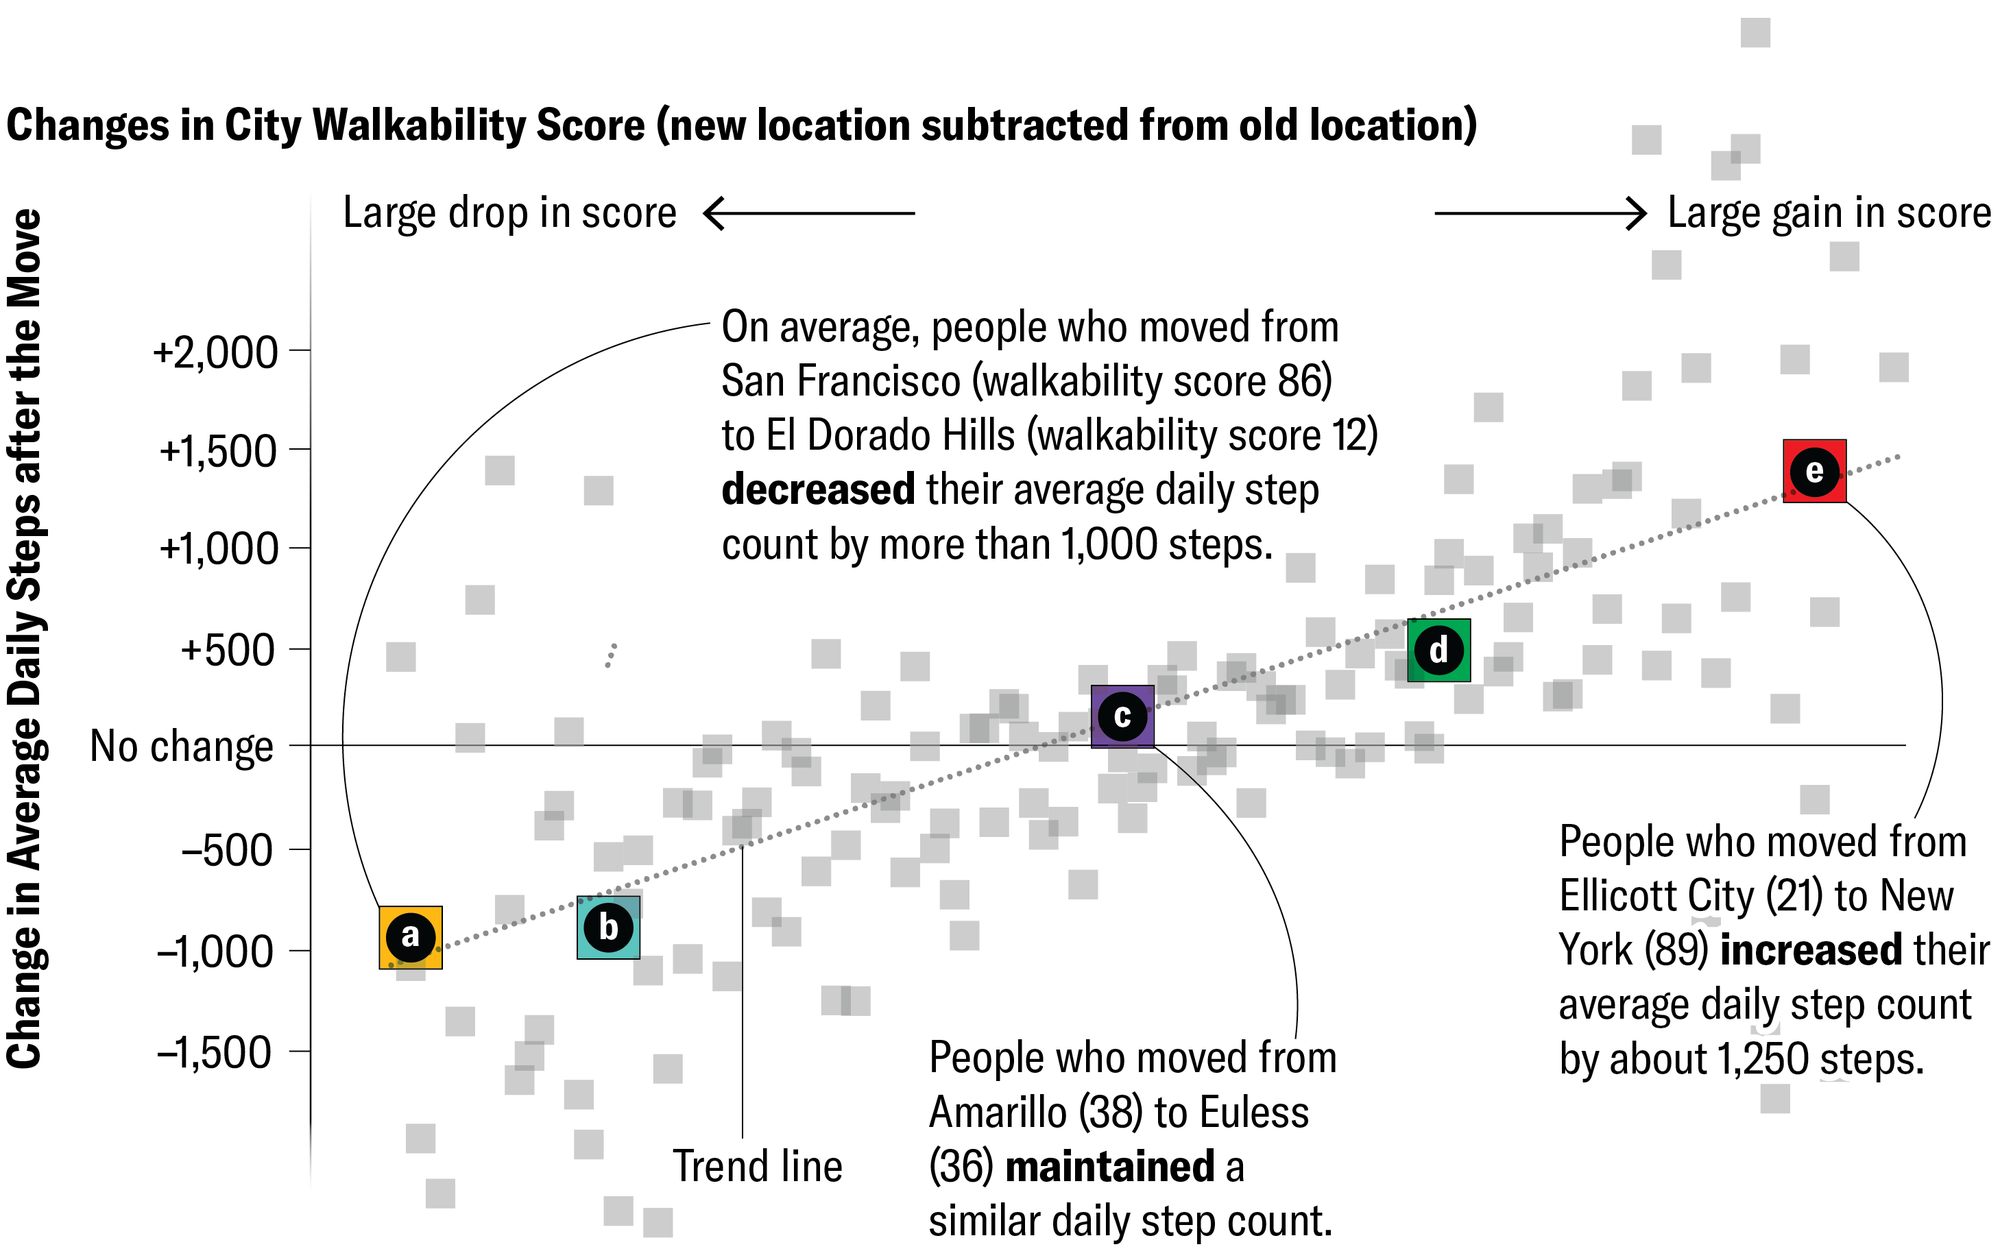
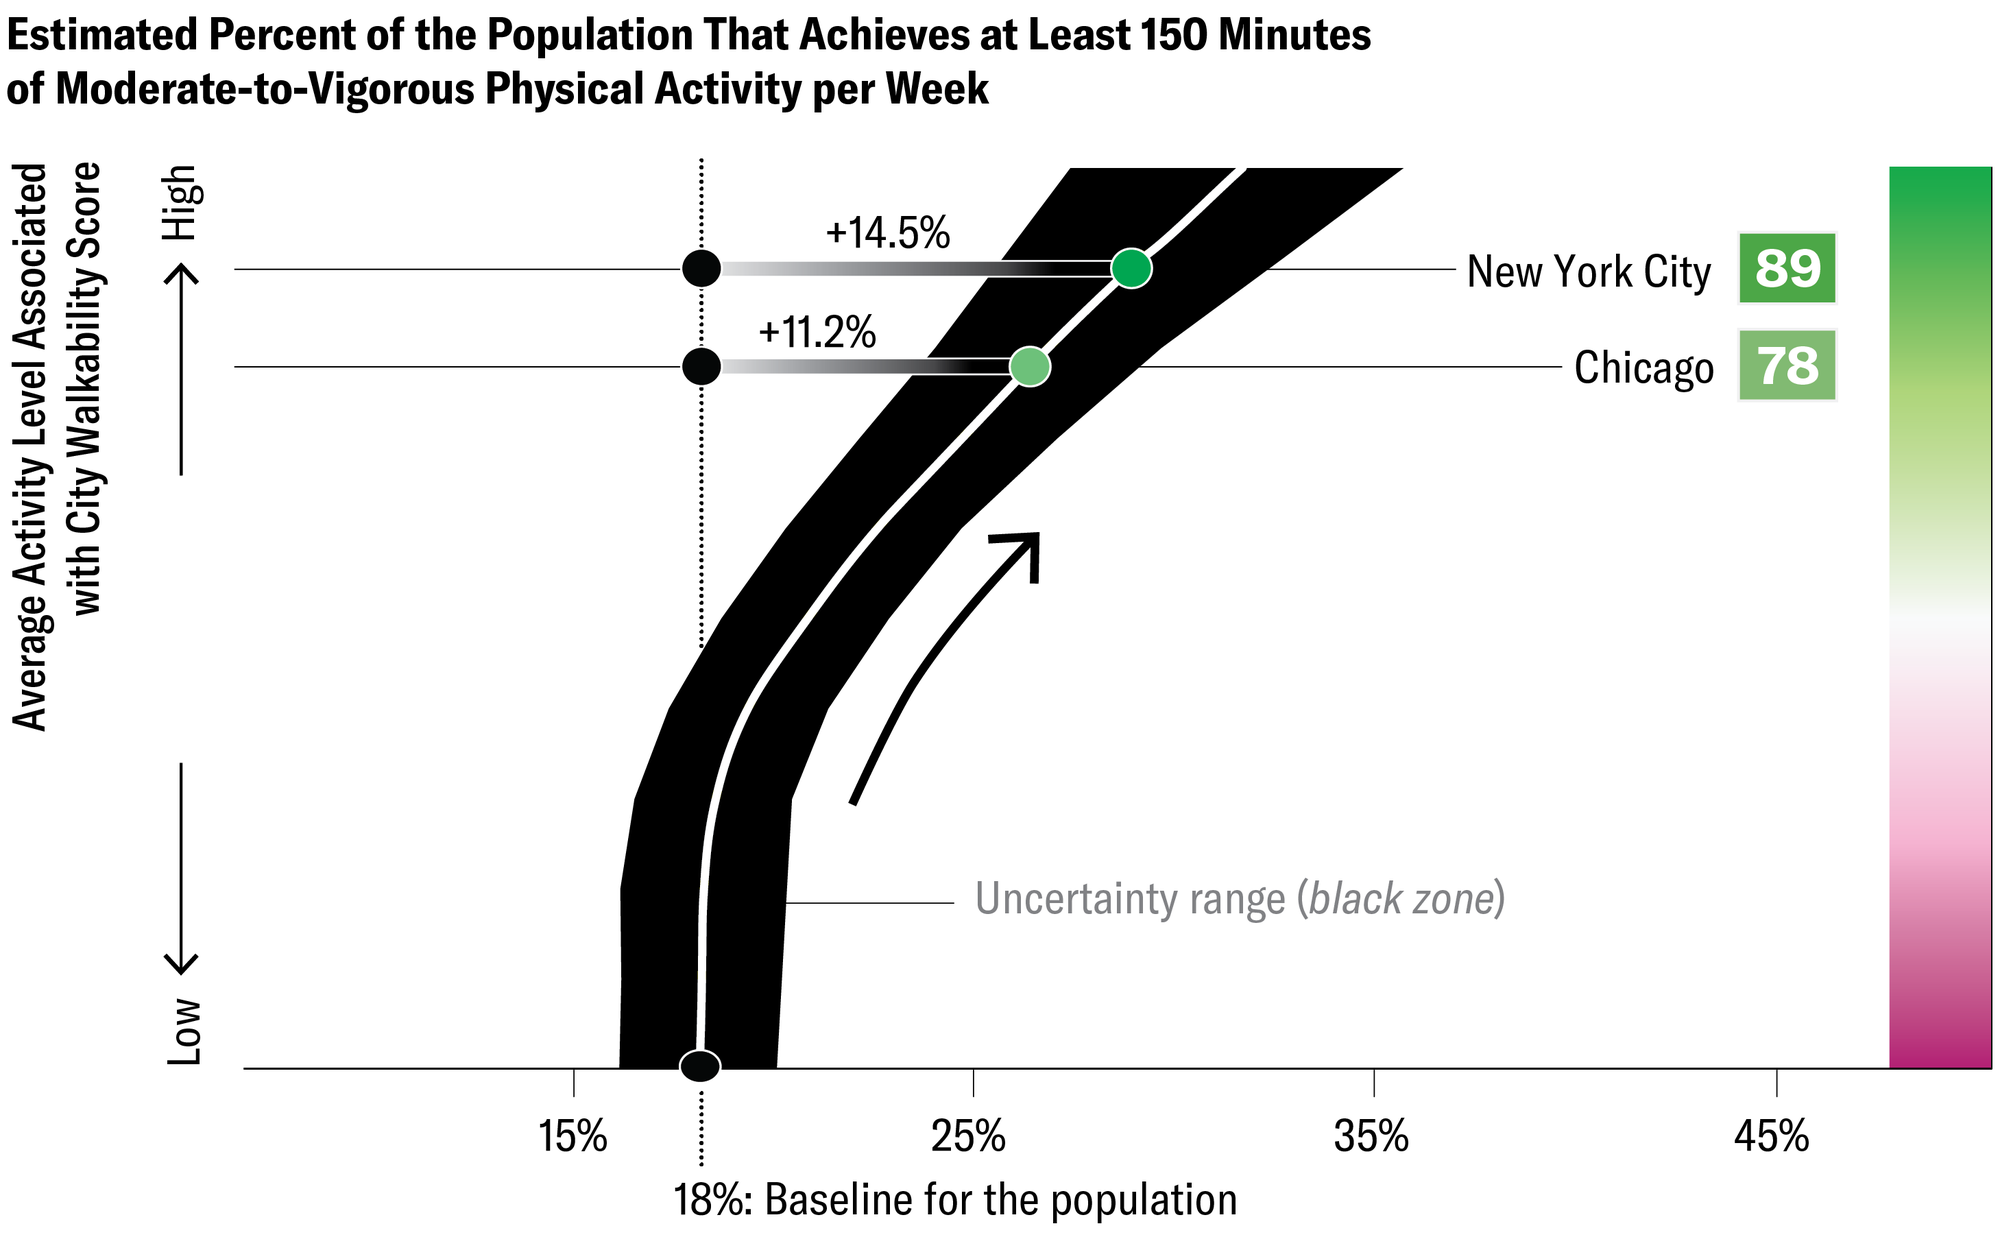
My two-page spread for Scientific American Does Your City Make You Healthier? appears in the March 2026 Graphics Science column, which selects one science topic each month for data-driven visual storytelling.
This graphics science piece examines how urban walkability shapes daily physical activity, visualizing smartphone step-count data from around two million people, including more than 5,000 individuals who moved across 1,600 U.S. cities. By comparing step counts before and after relocation, the analysis helps disentangle whether walkable environments actively encourage more movement or simply attract people who are already more active. The findings show that moving to more walkable cities is linked to an average increase of about 1,100 steps per day—roughly 11 additional minutes of walking—underscoring how city design can meaningfully influence everyday health behaviors.
Read the complimentary PDF version here
Four Million U.S. Children Had No Health Insurance in 2024. Some Will Die of Cancer
December 2025 • Scientific American
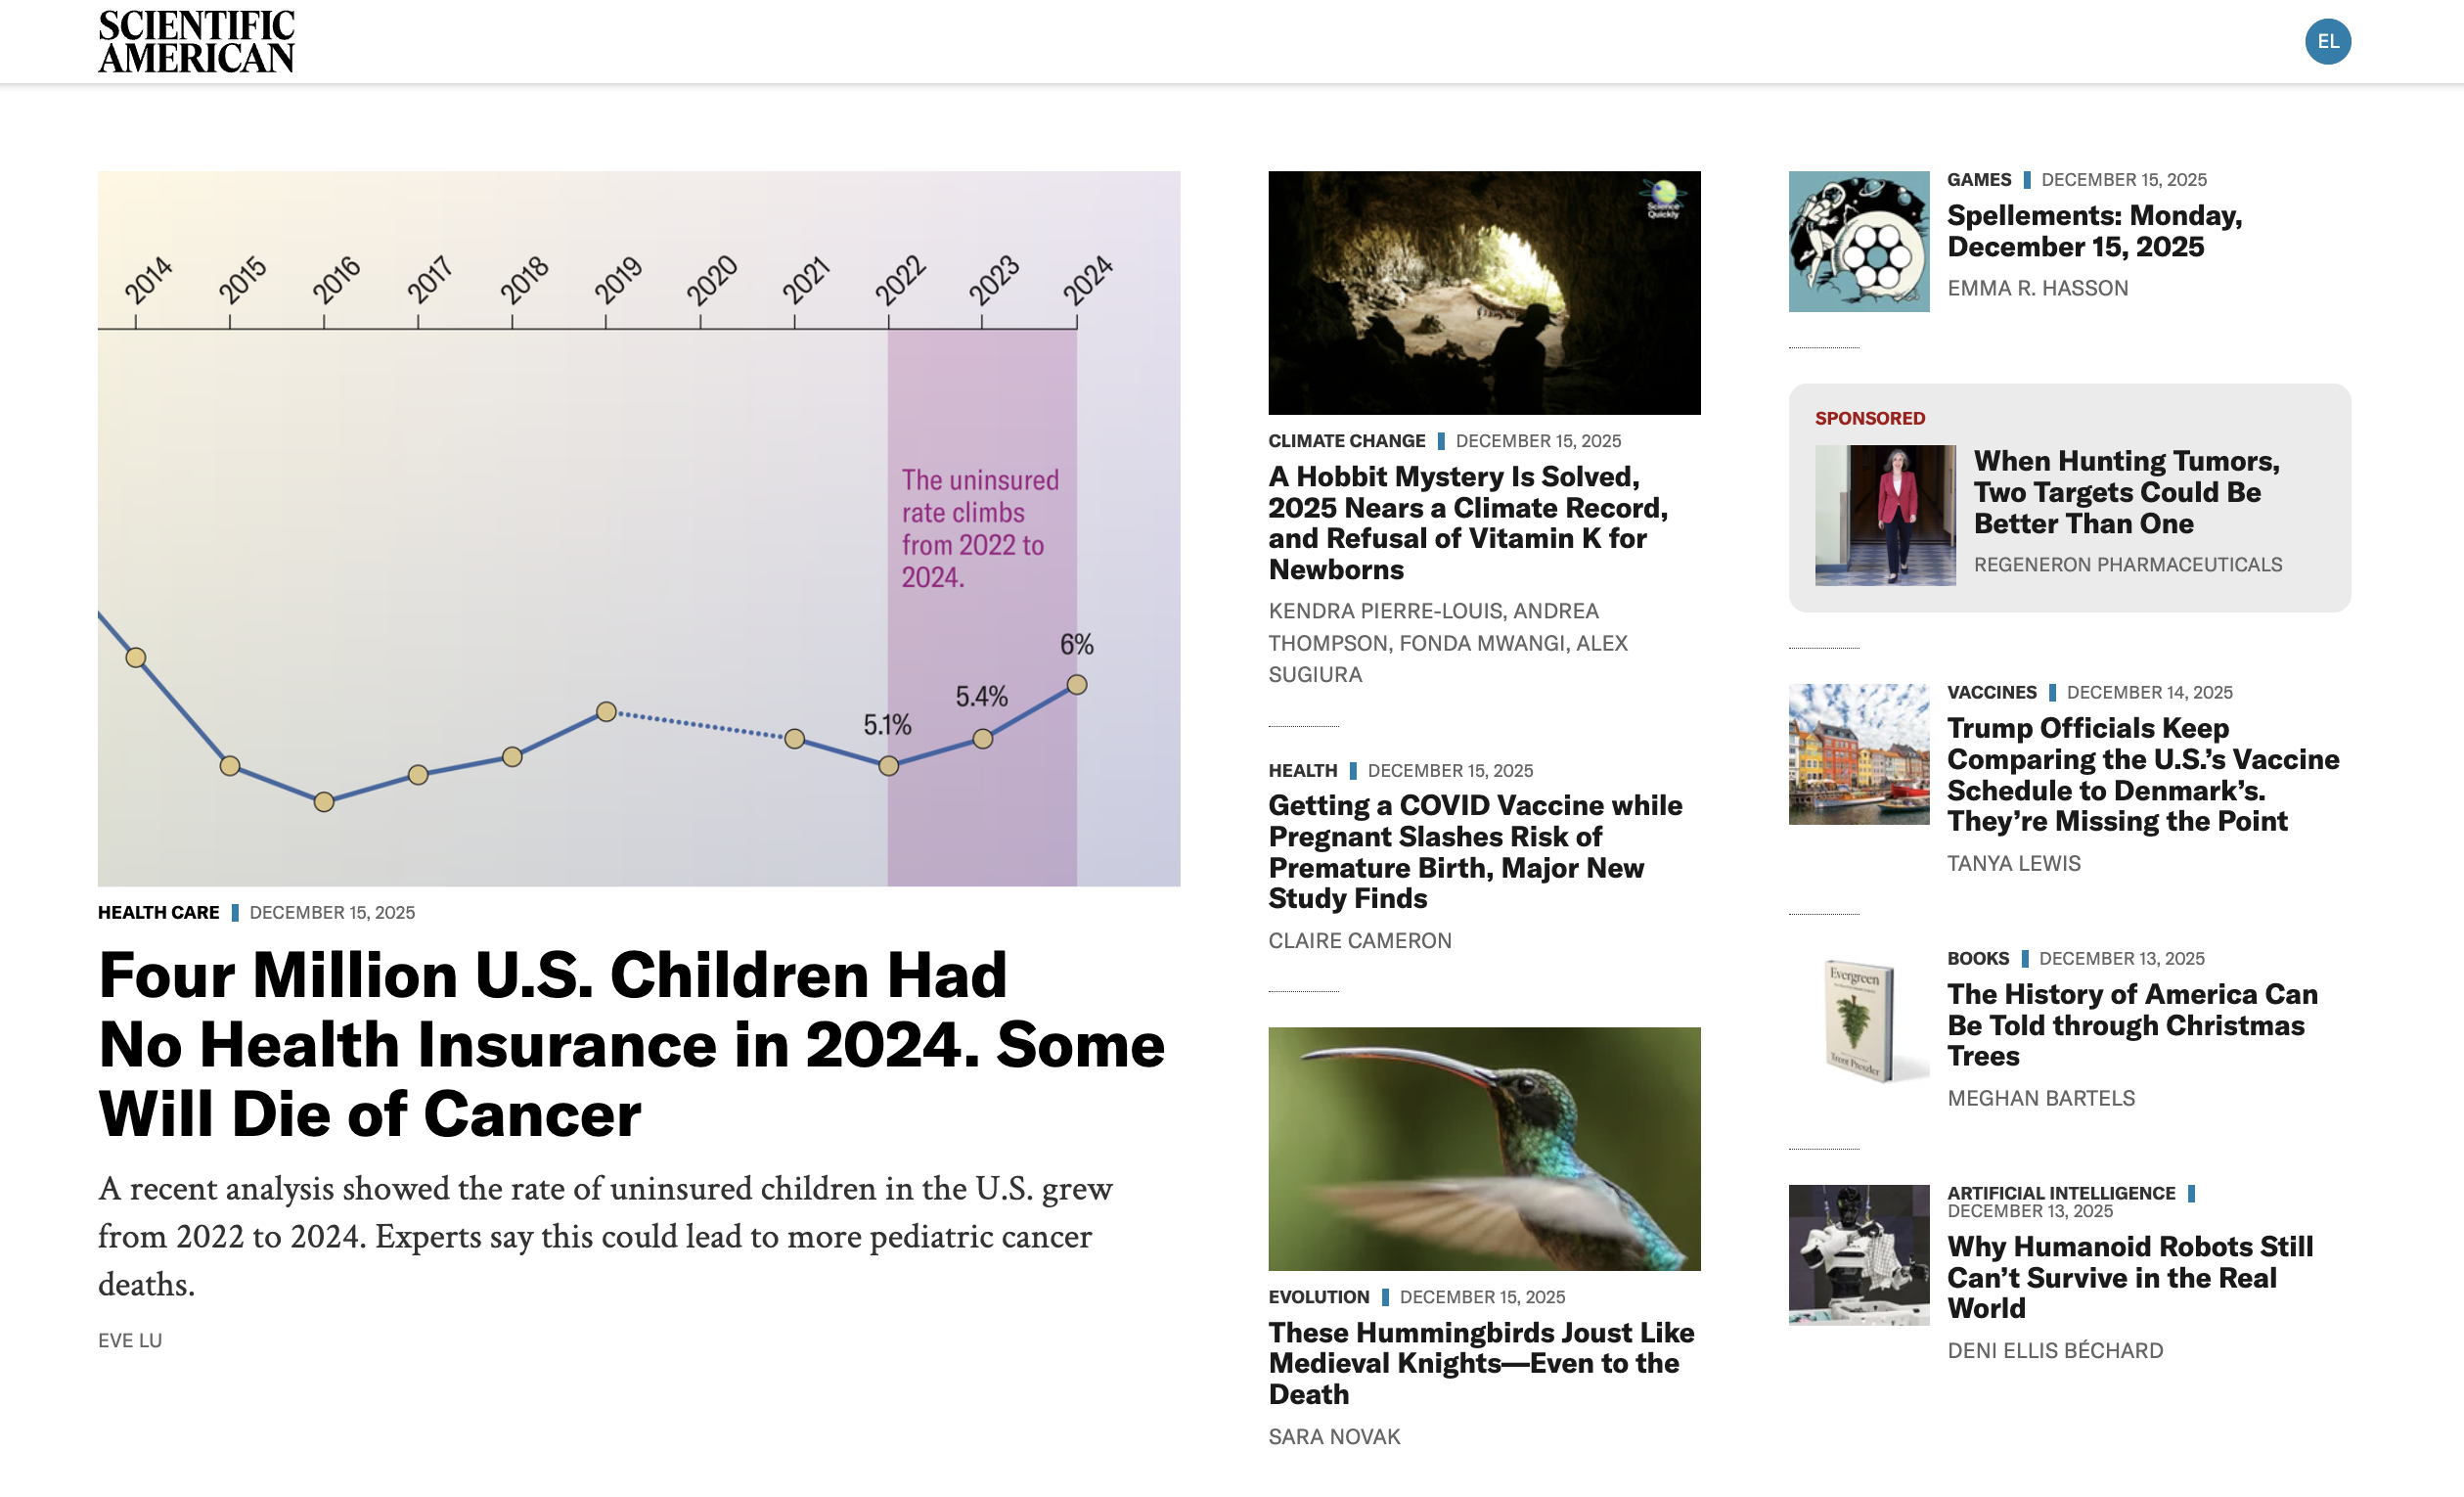

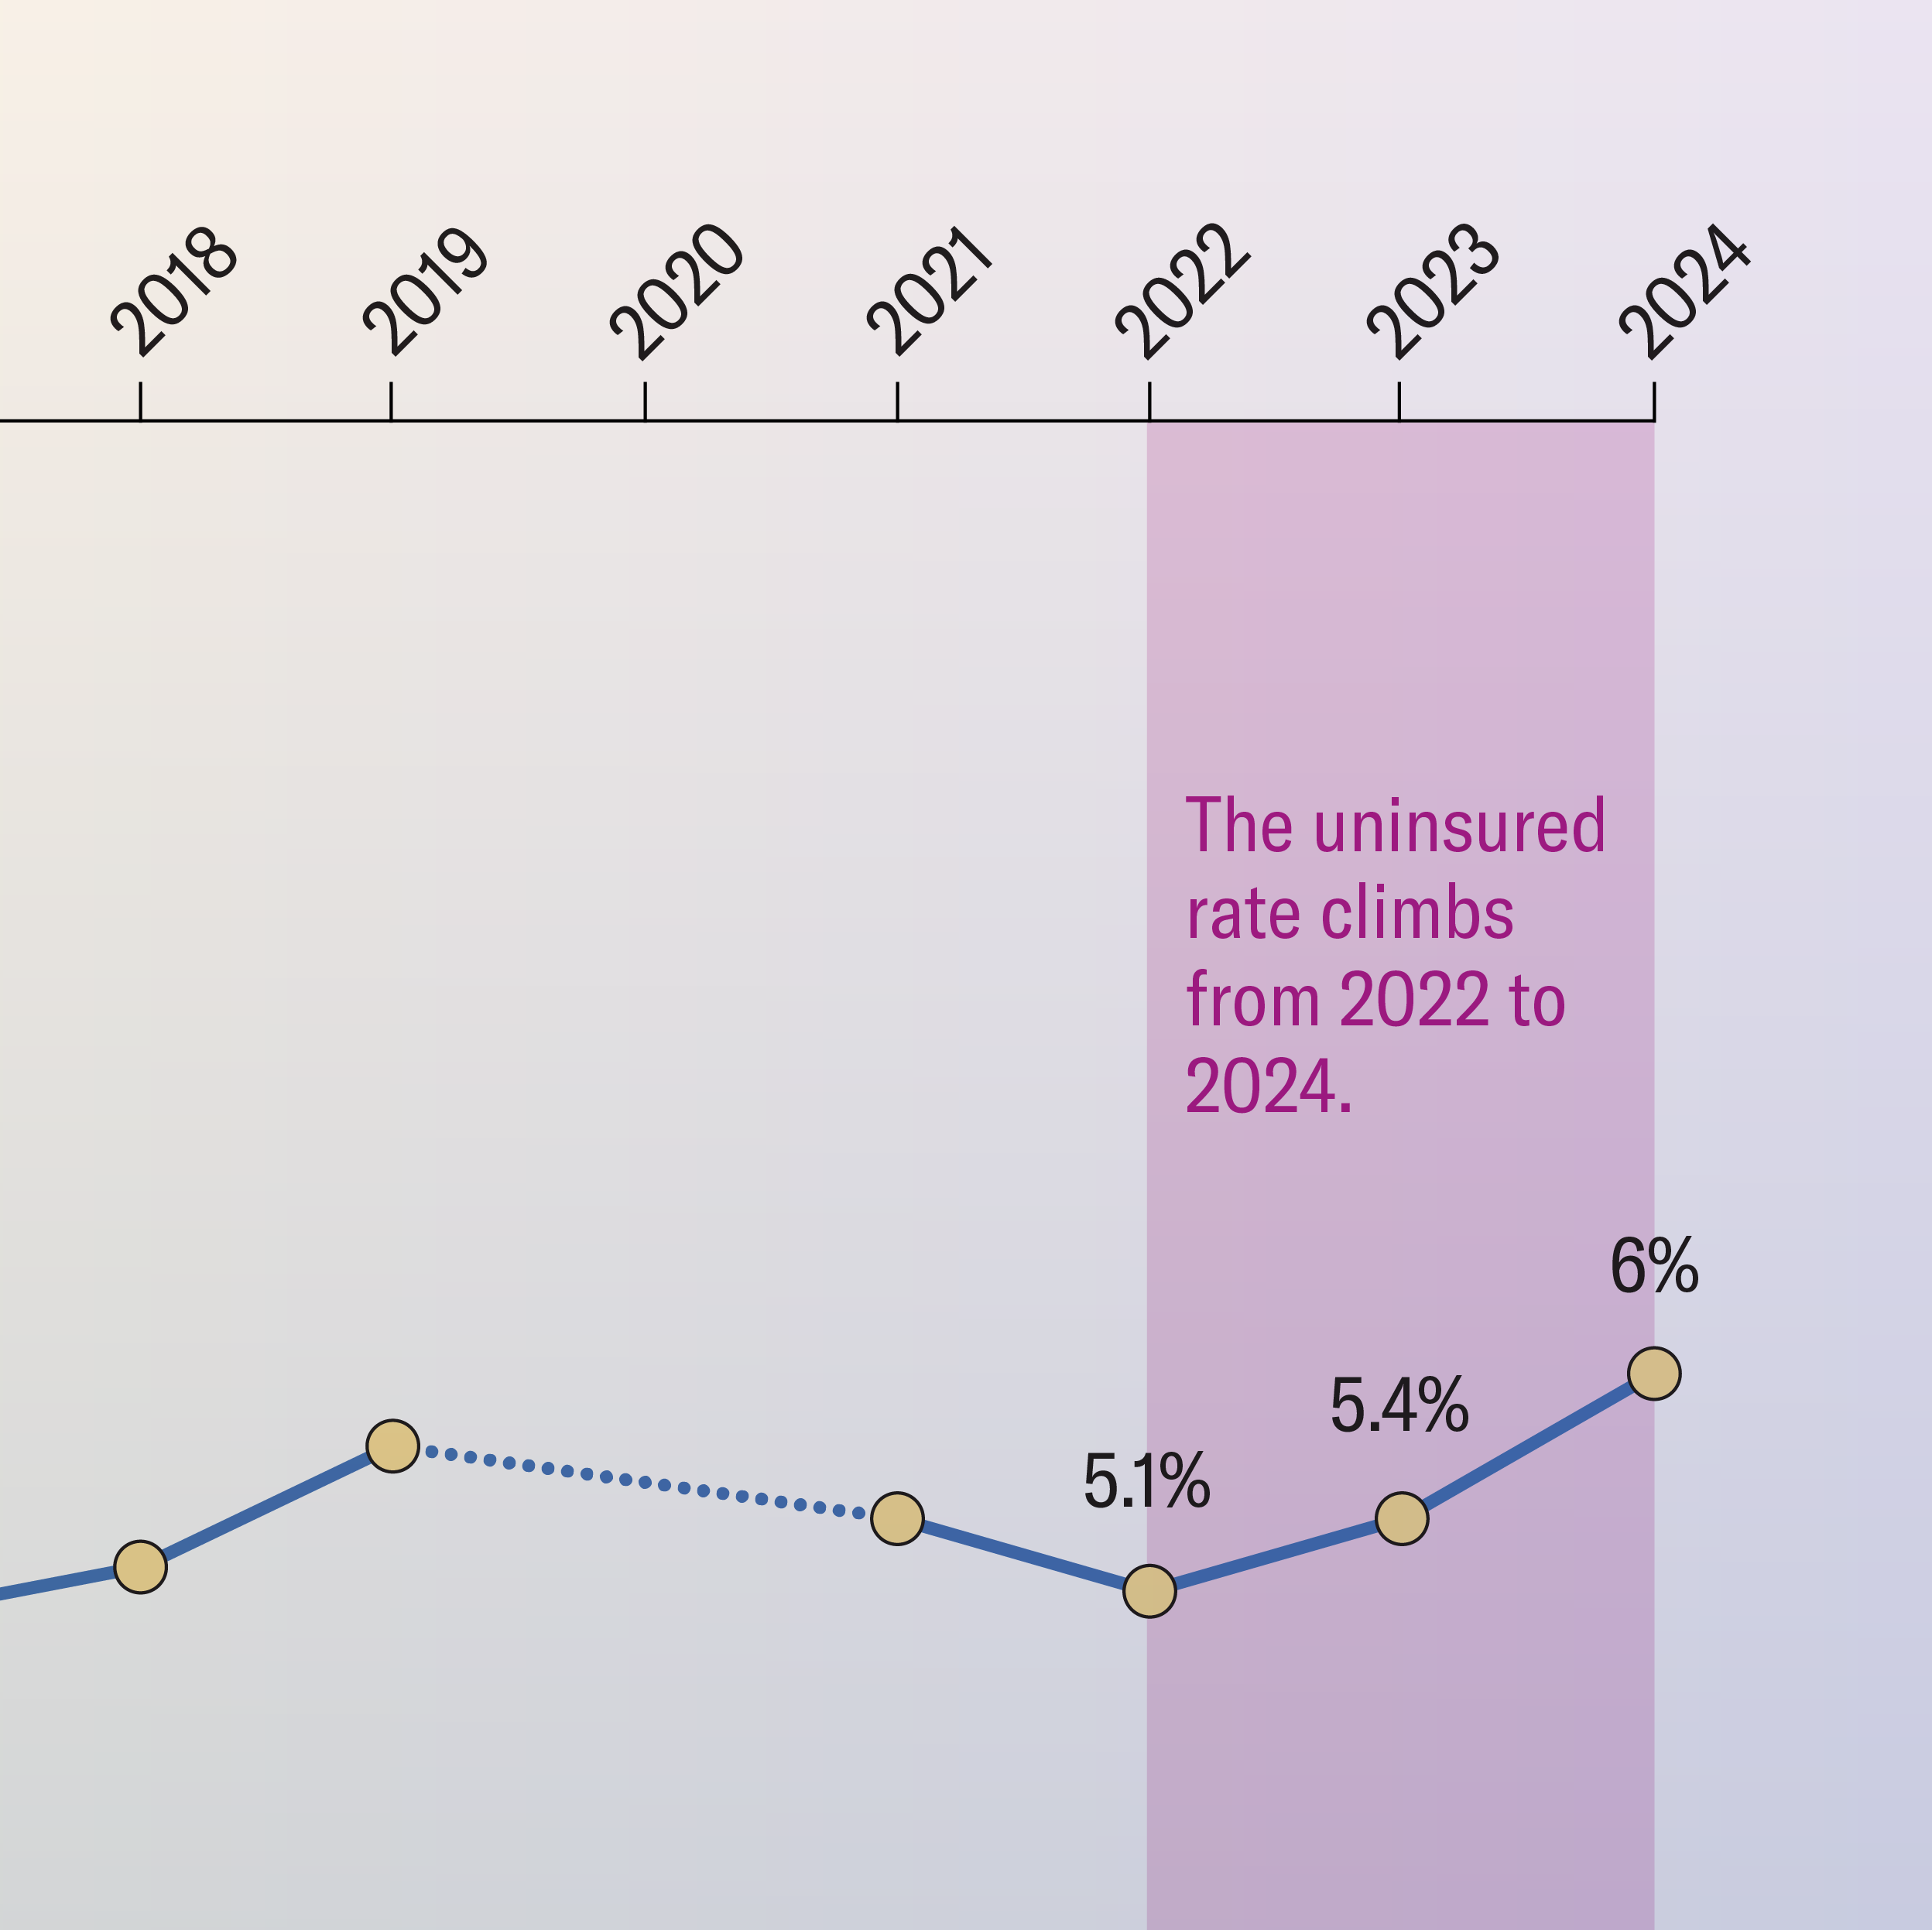
My solo byline for a Scientific American story How Rising Rates of Uninsured Children Will Increase Pediatric Cancer Deaths, edited by Tanya Lewis (text) and Amanda Montañez (graphics), is now live online.
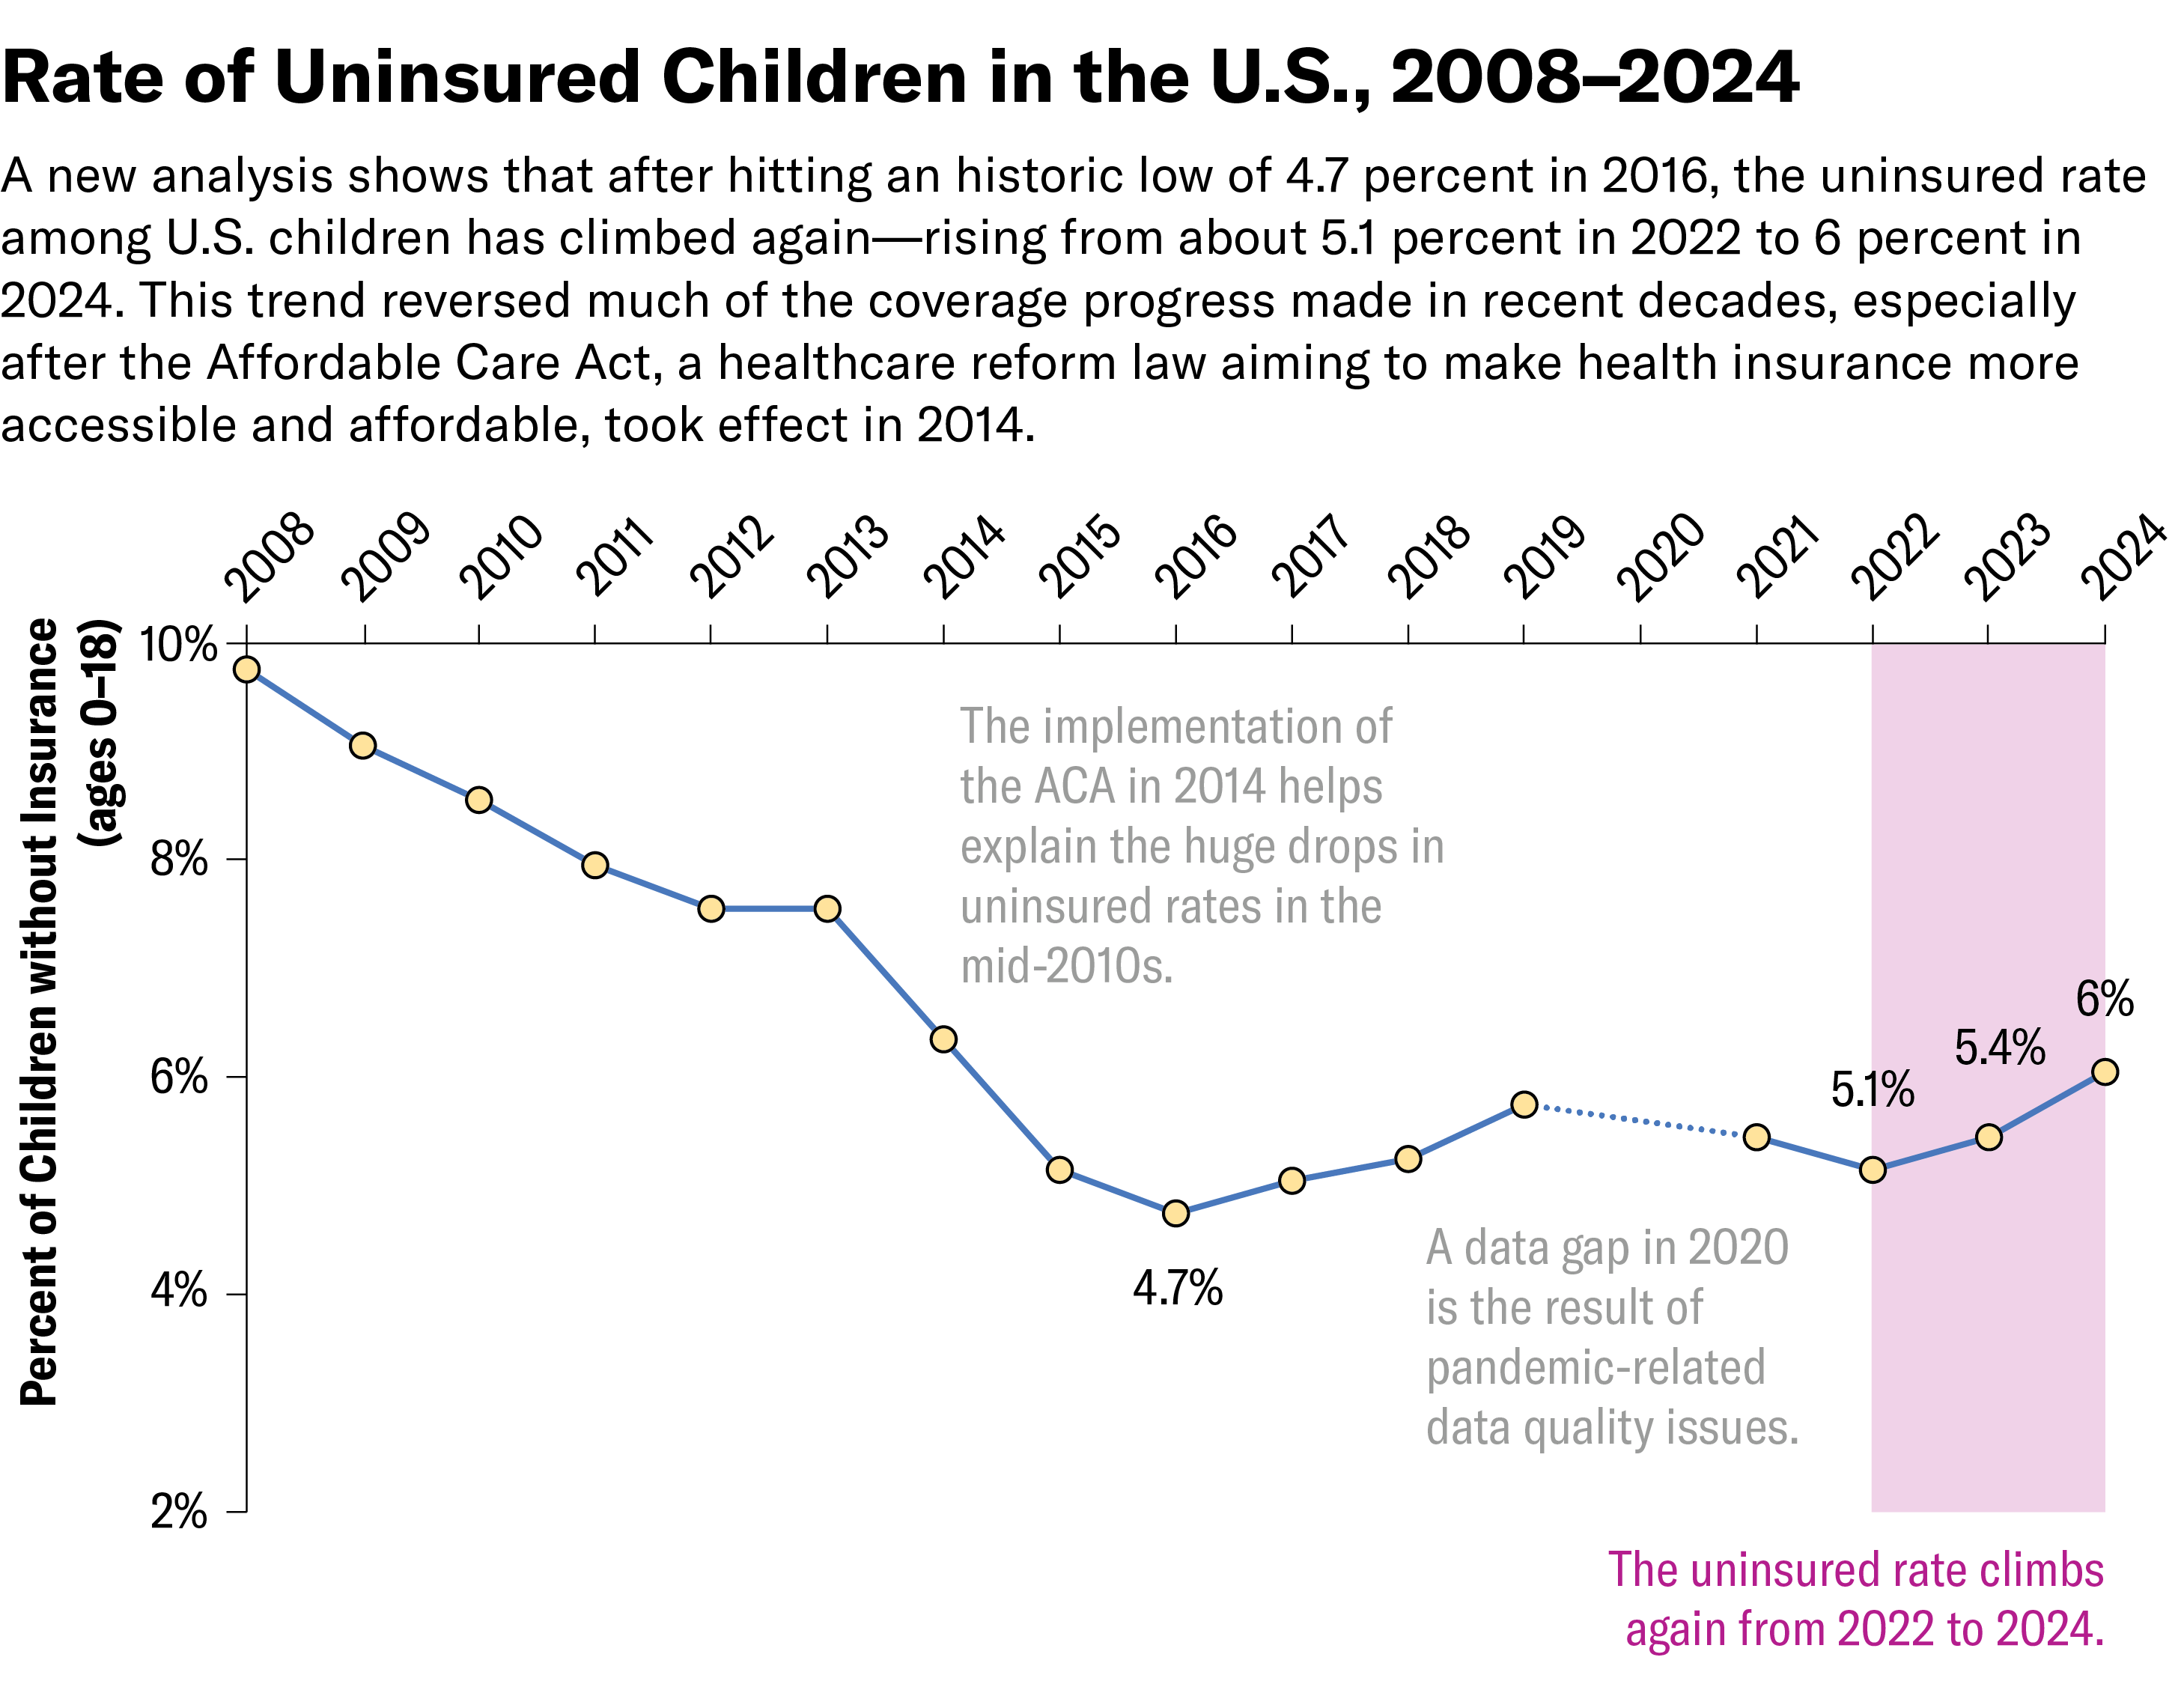
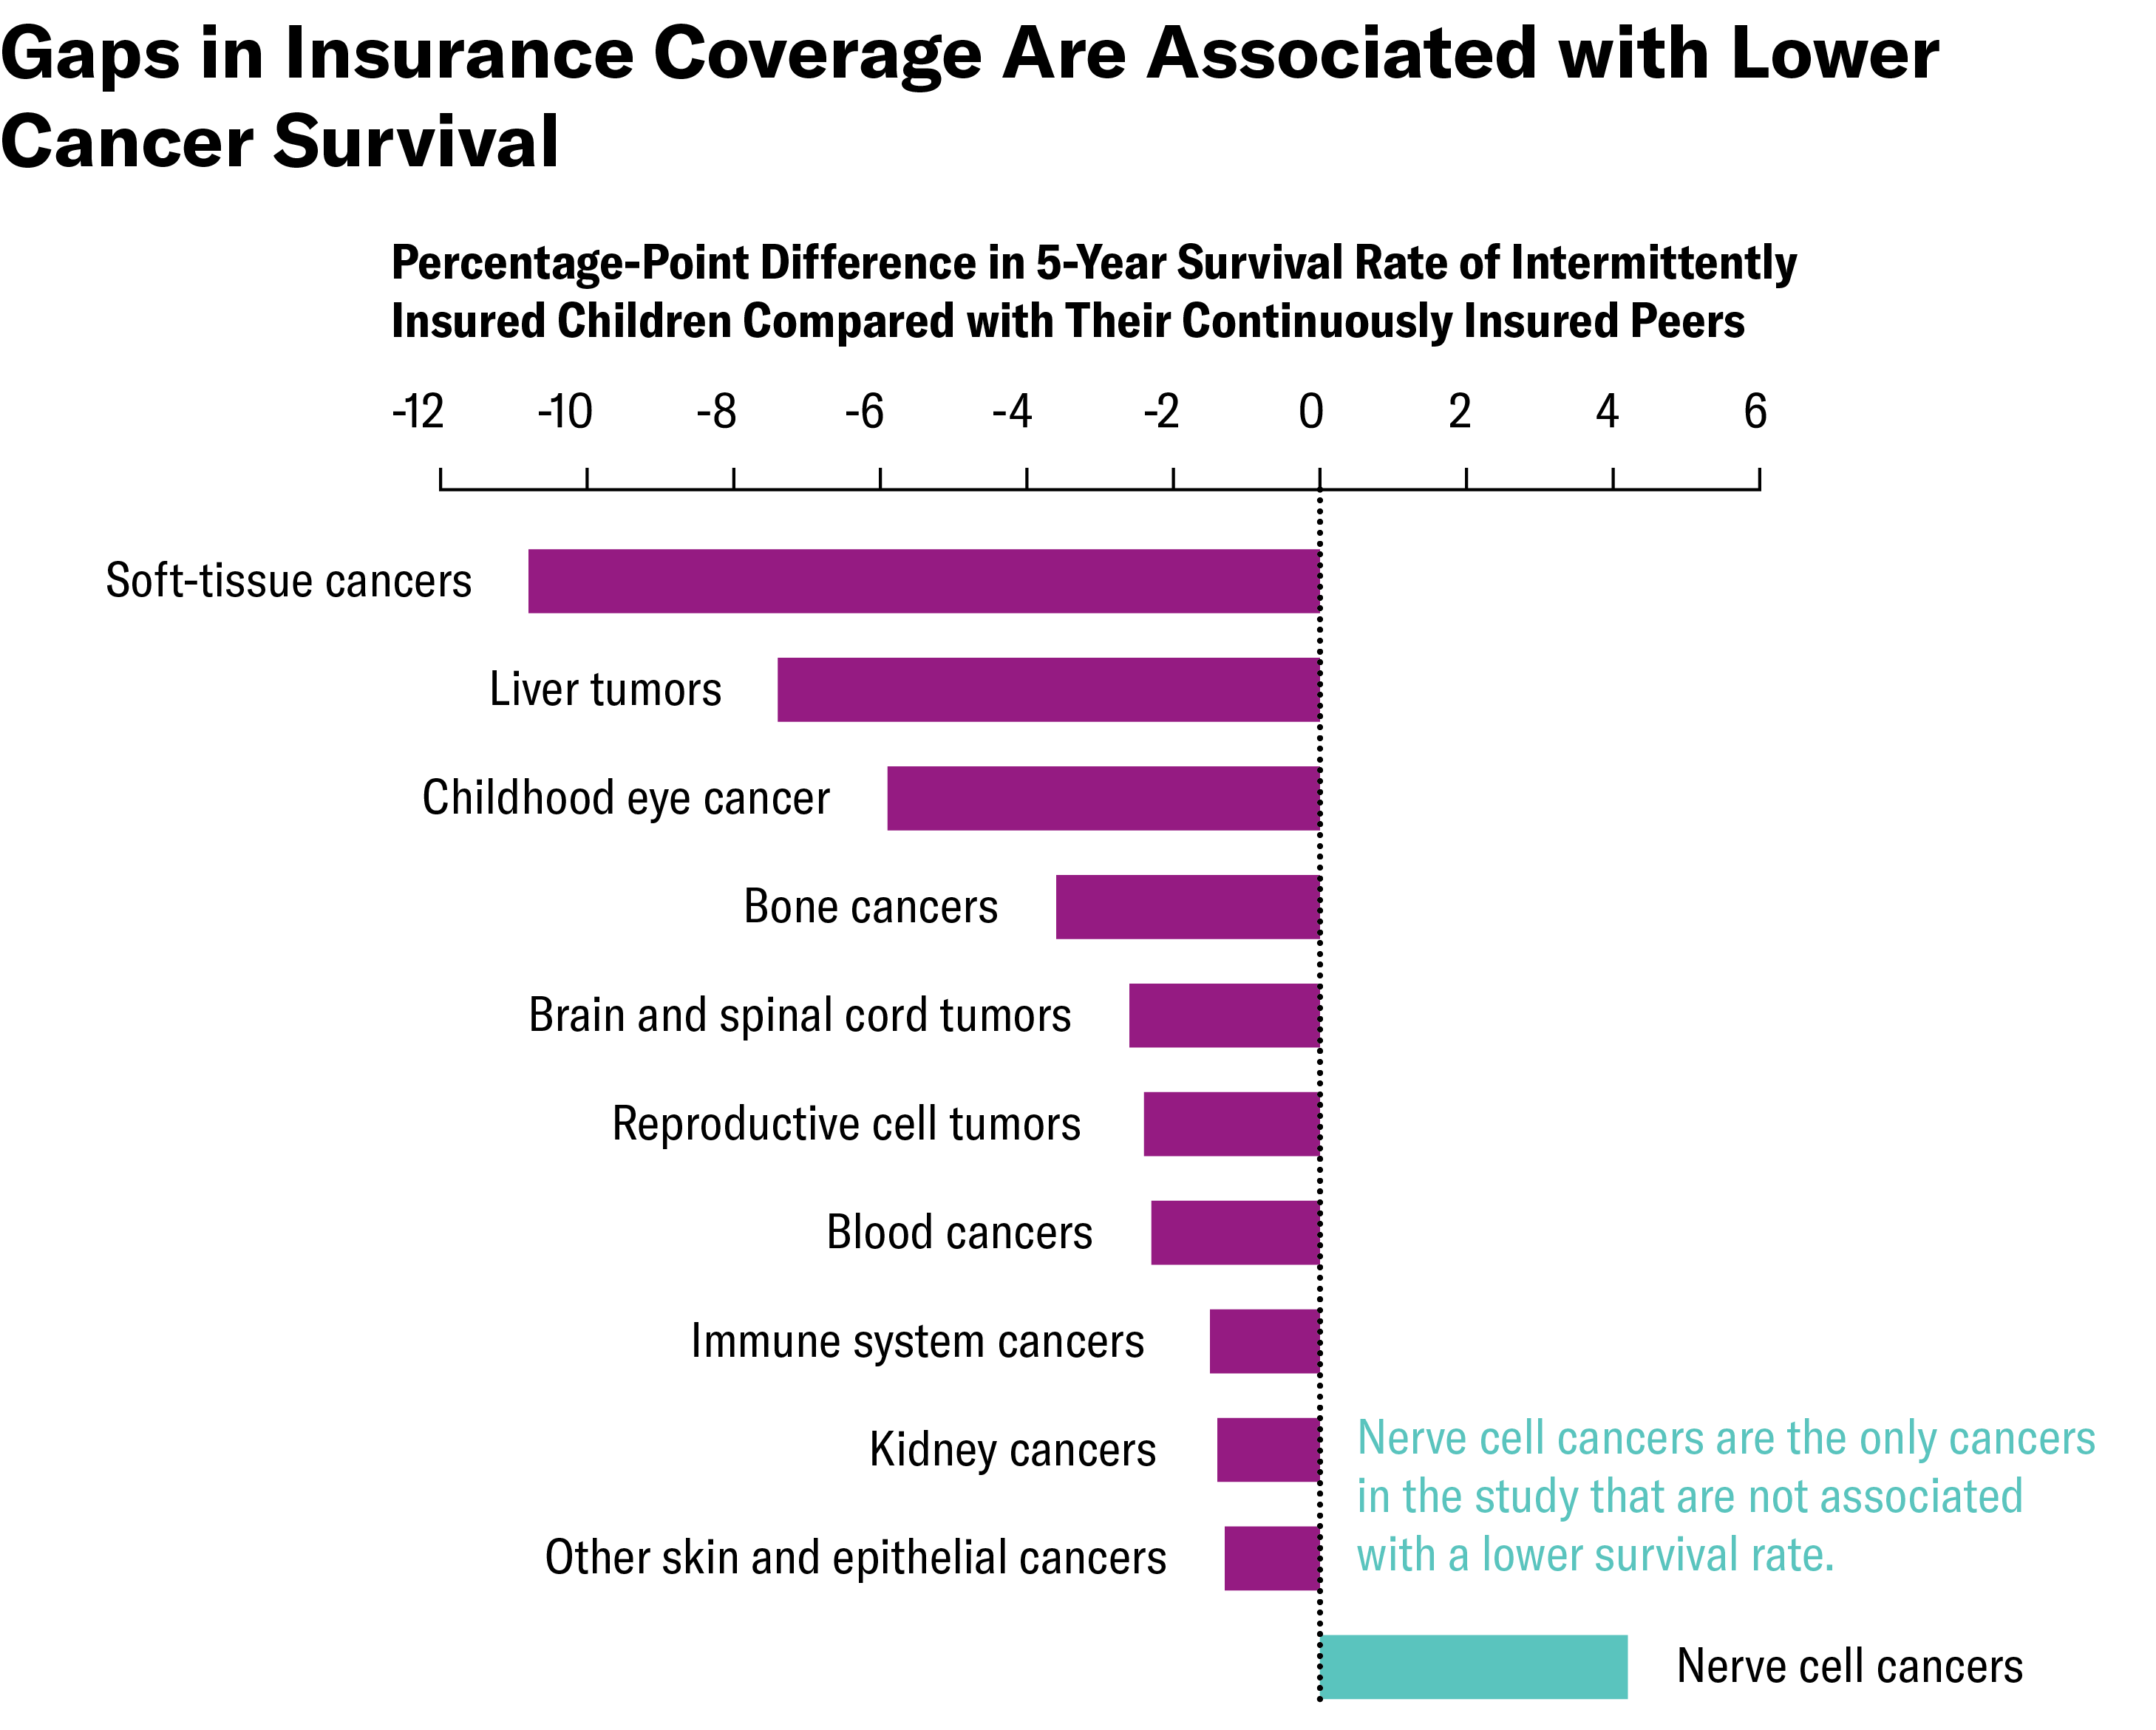
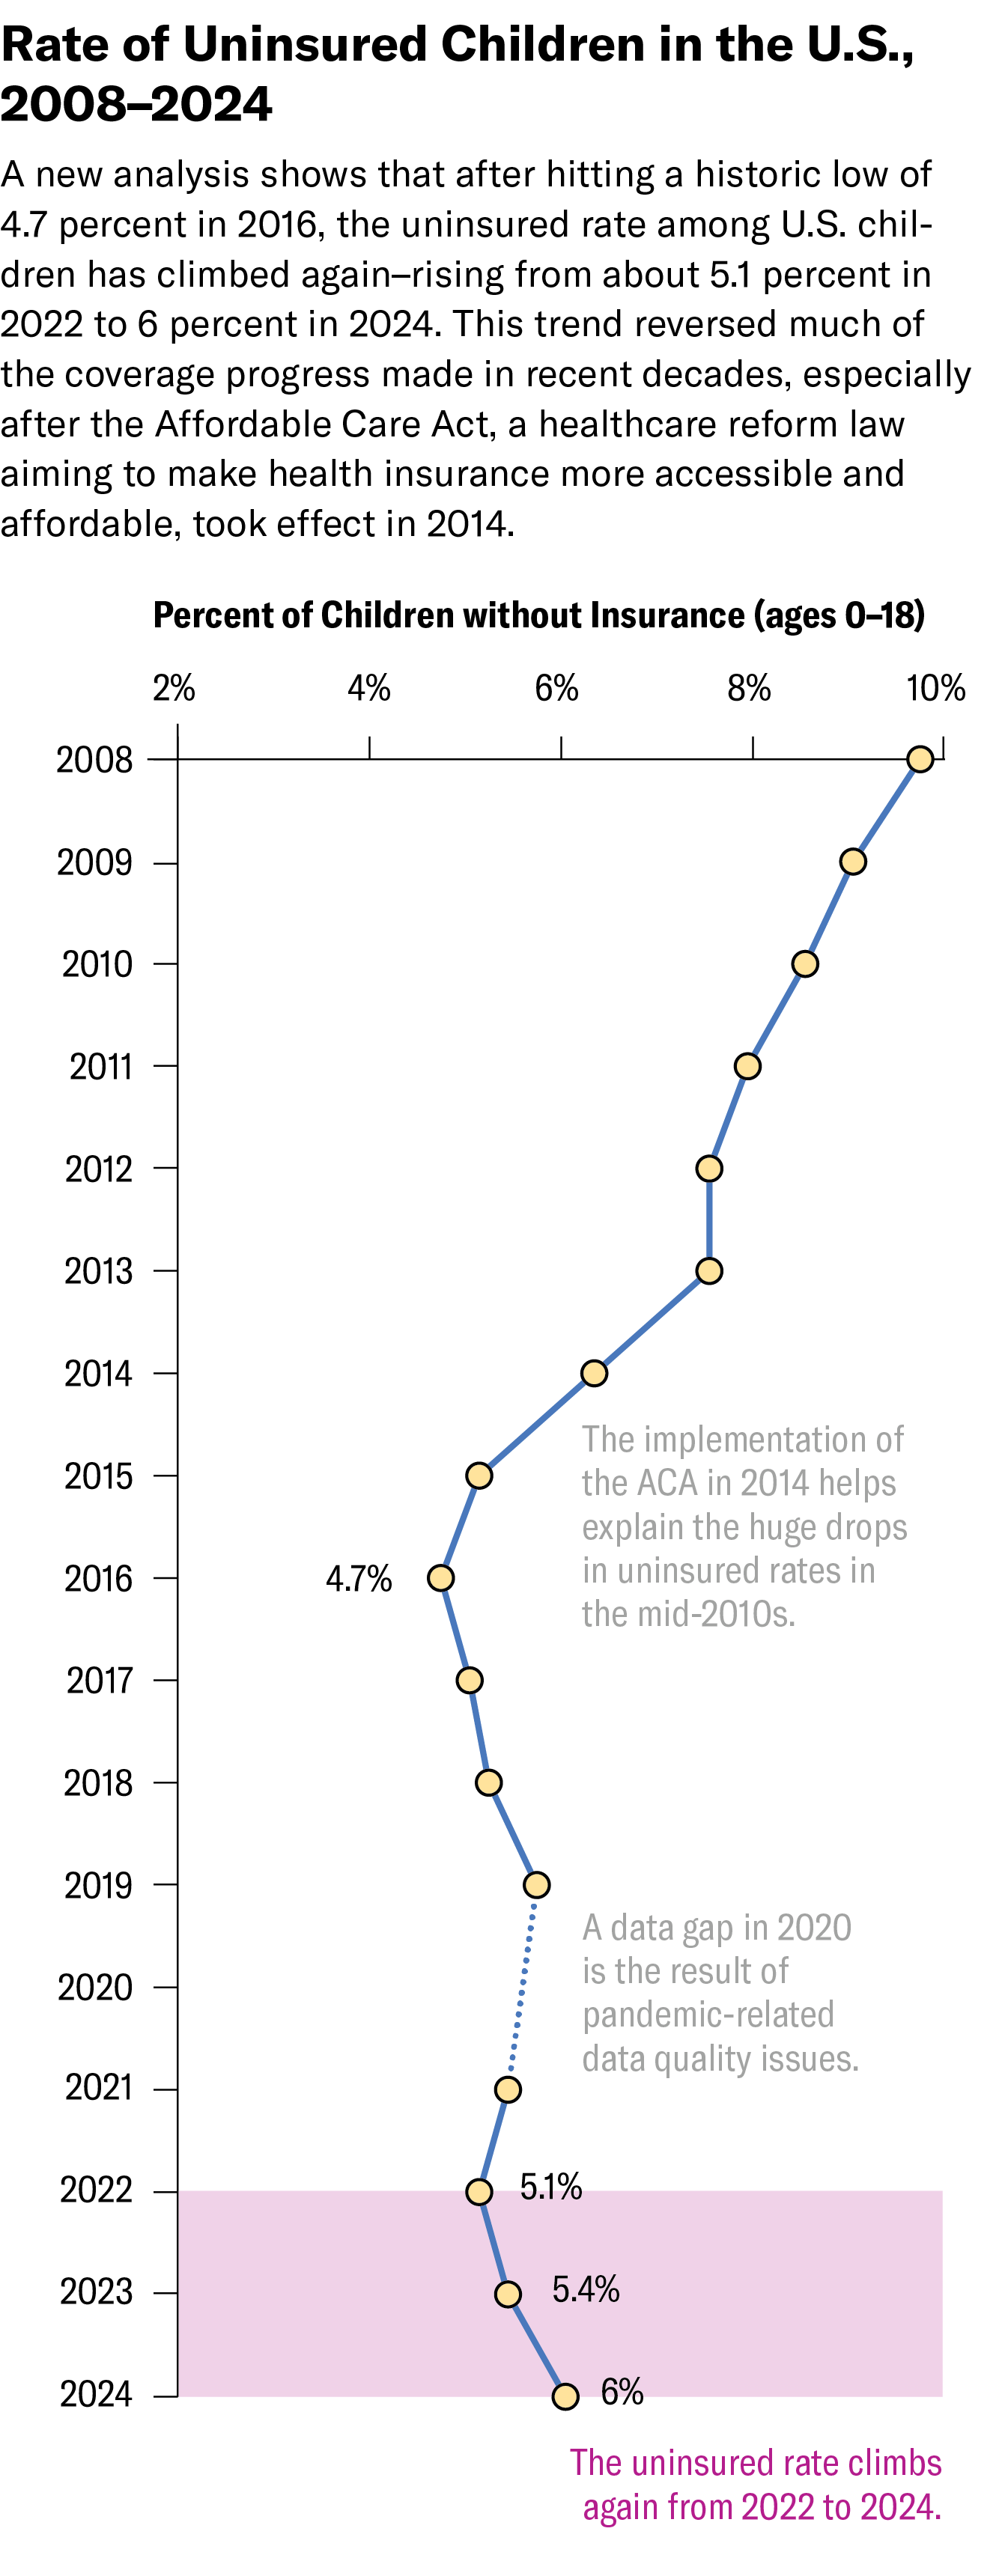
The story looks at new analyses showing U.S. children have been losing health insurance since 2022, reversing years of coverage gains after the Affordable Care Act. Joan Alker explains how the rollback of pandemic-era protections and mounting Medicaid hurdles have fueled the decline—and why its impact is especially dangerous for children with serious illnesses such as pediatric cancers. I interviewed cancer epidemiologist Kim Johnson and health economist Derek Brown of Washington University in St. Louis, whose research shows uninsured children were more likely to be diagnosed at later cancer stages and to die within five years than those with private insurance, highlighting how coverage gaps can delay diagnosis and disrupt treatment.
Read the complimentary PDF version here
AI Reads Your Tongue Color to Reveal Hidden Diseases
October 2025 • Scientific American
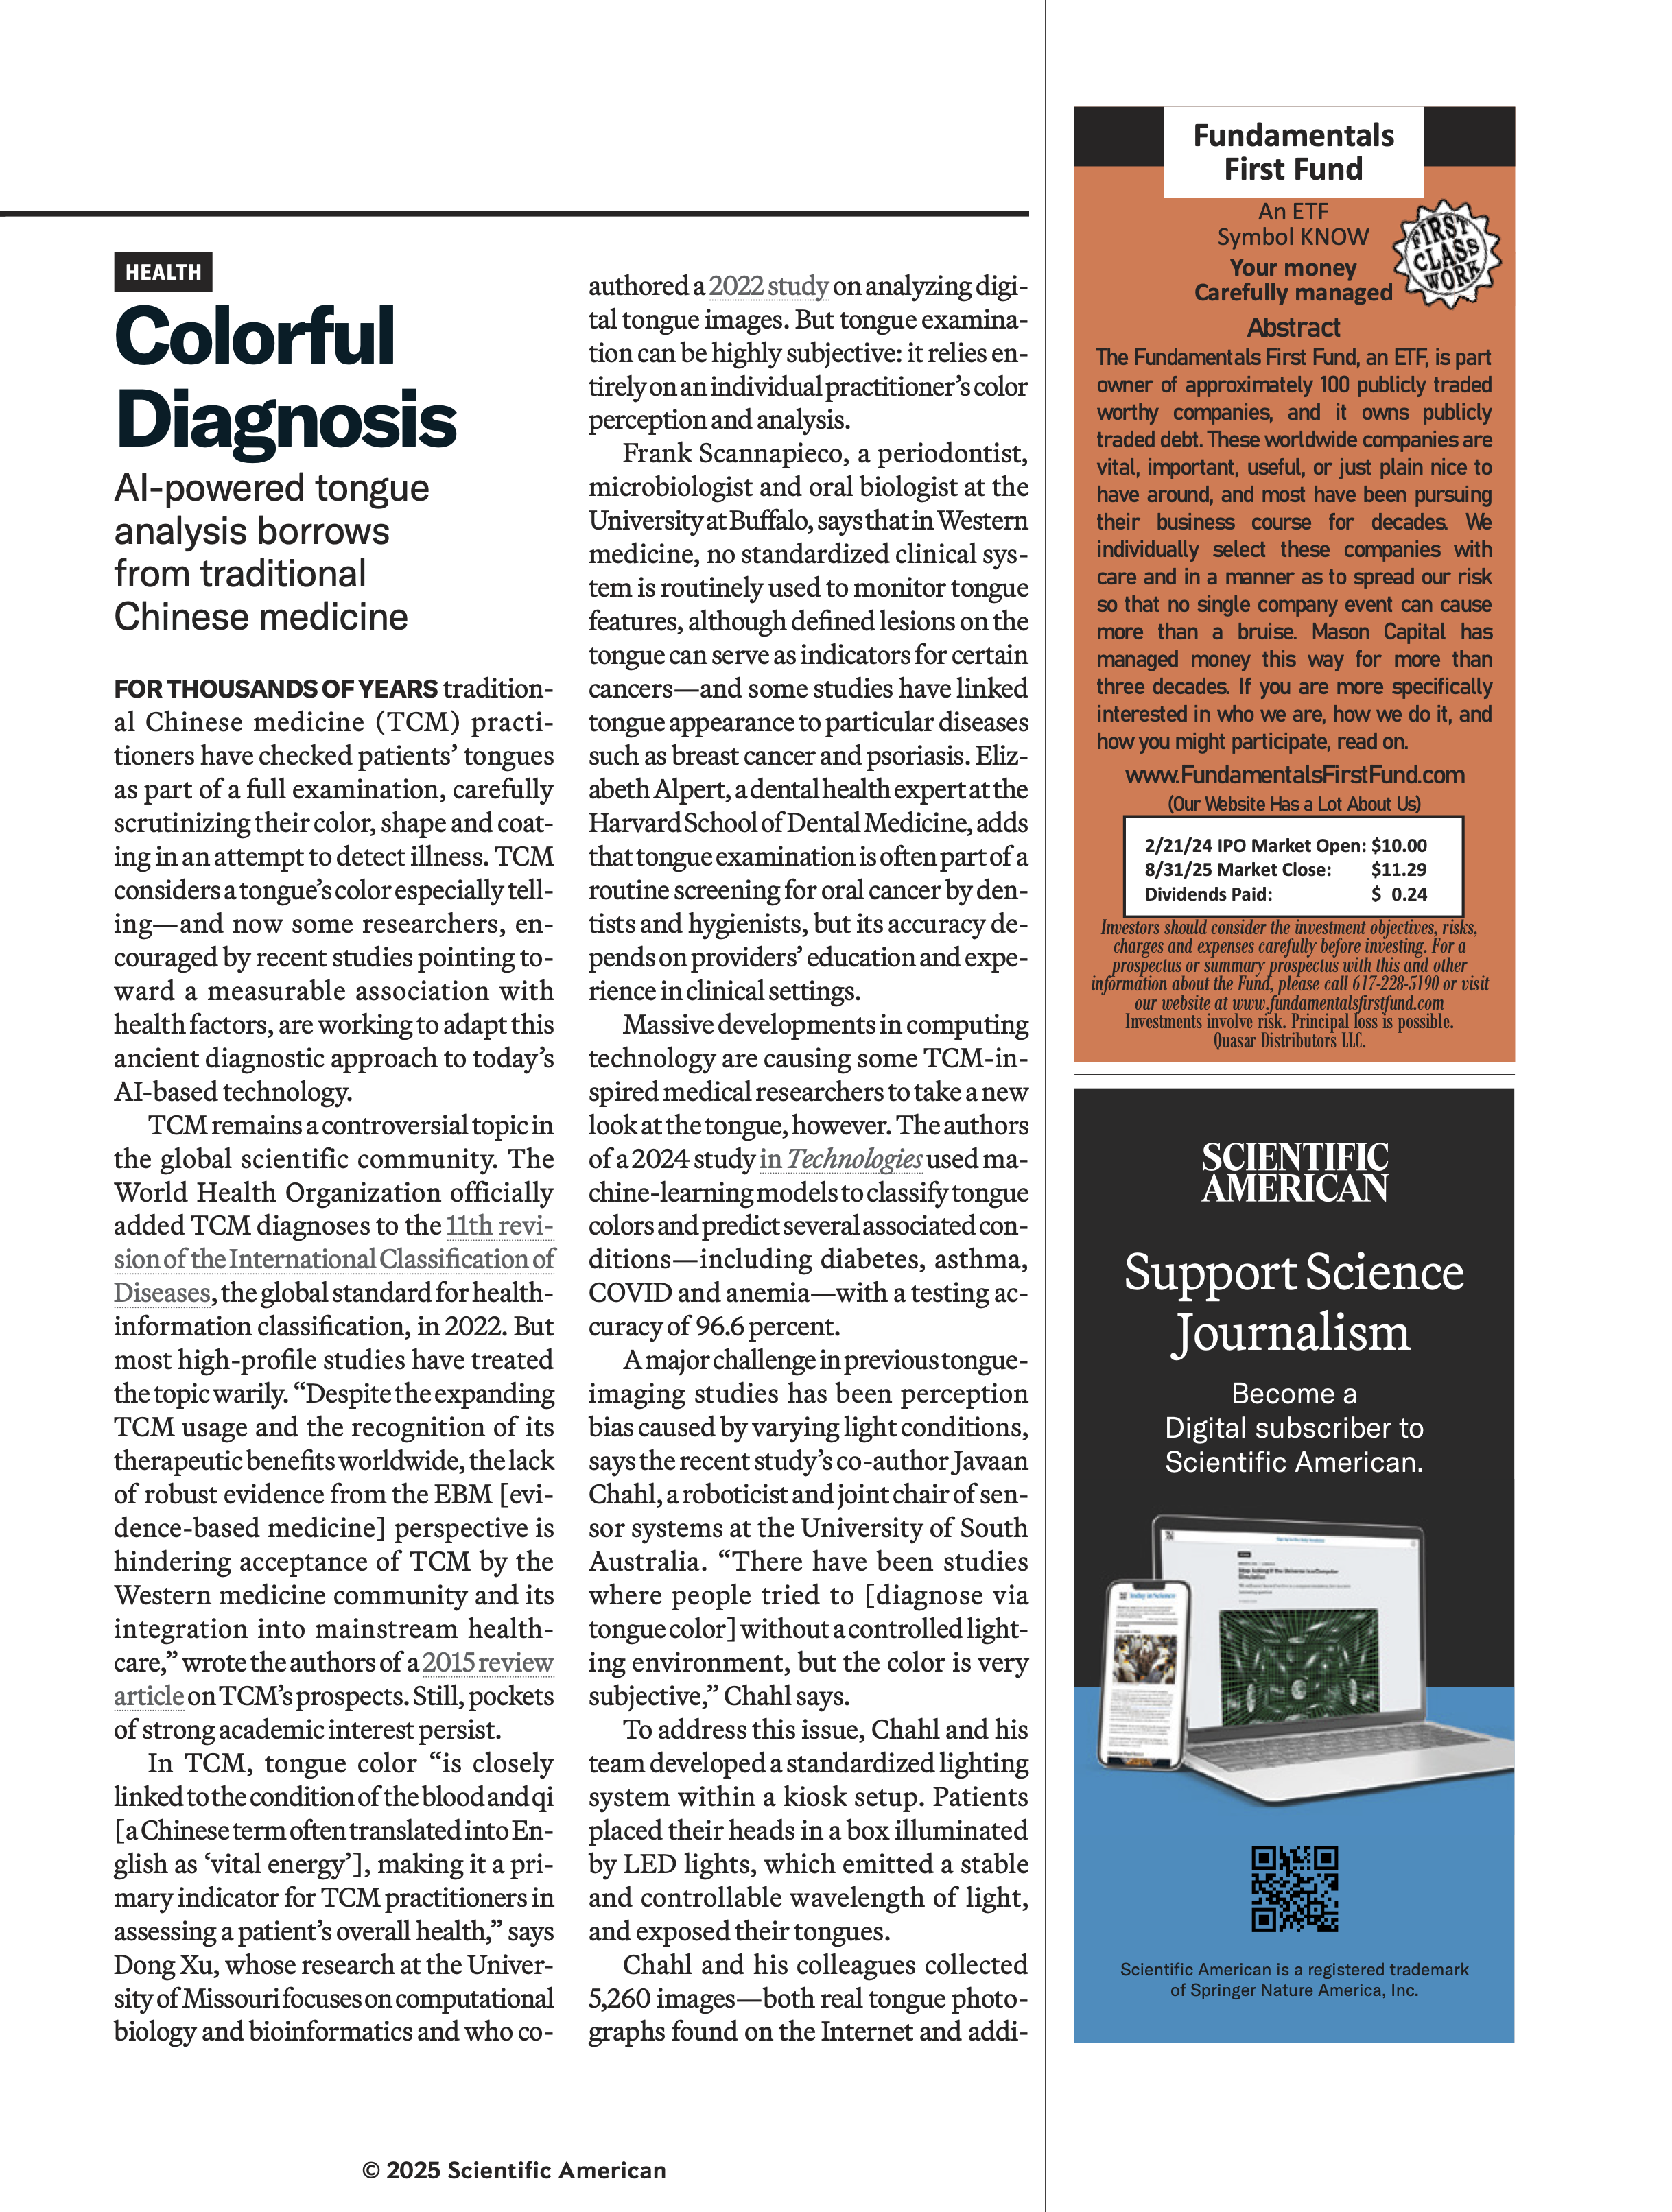
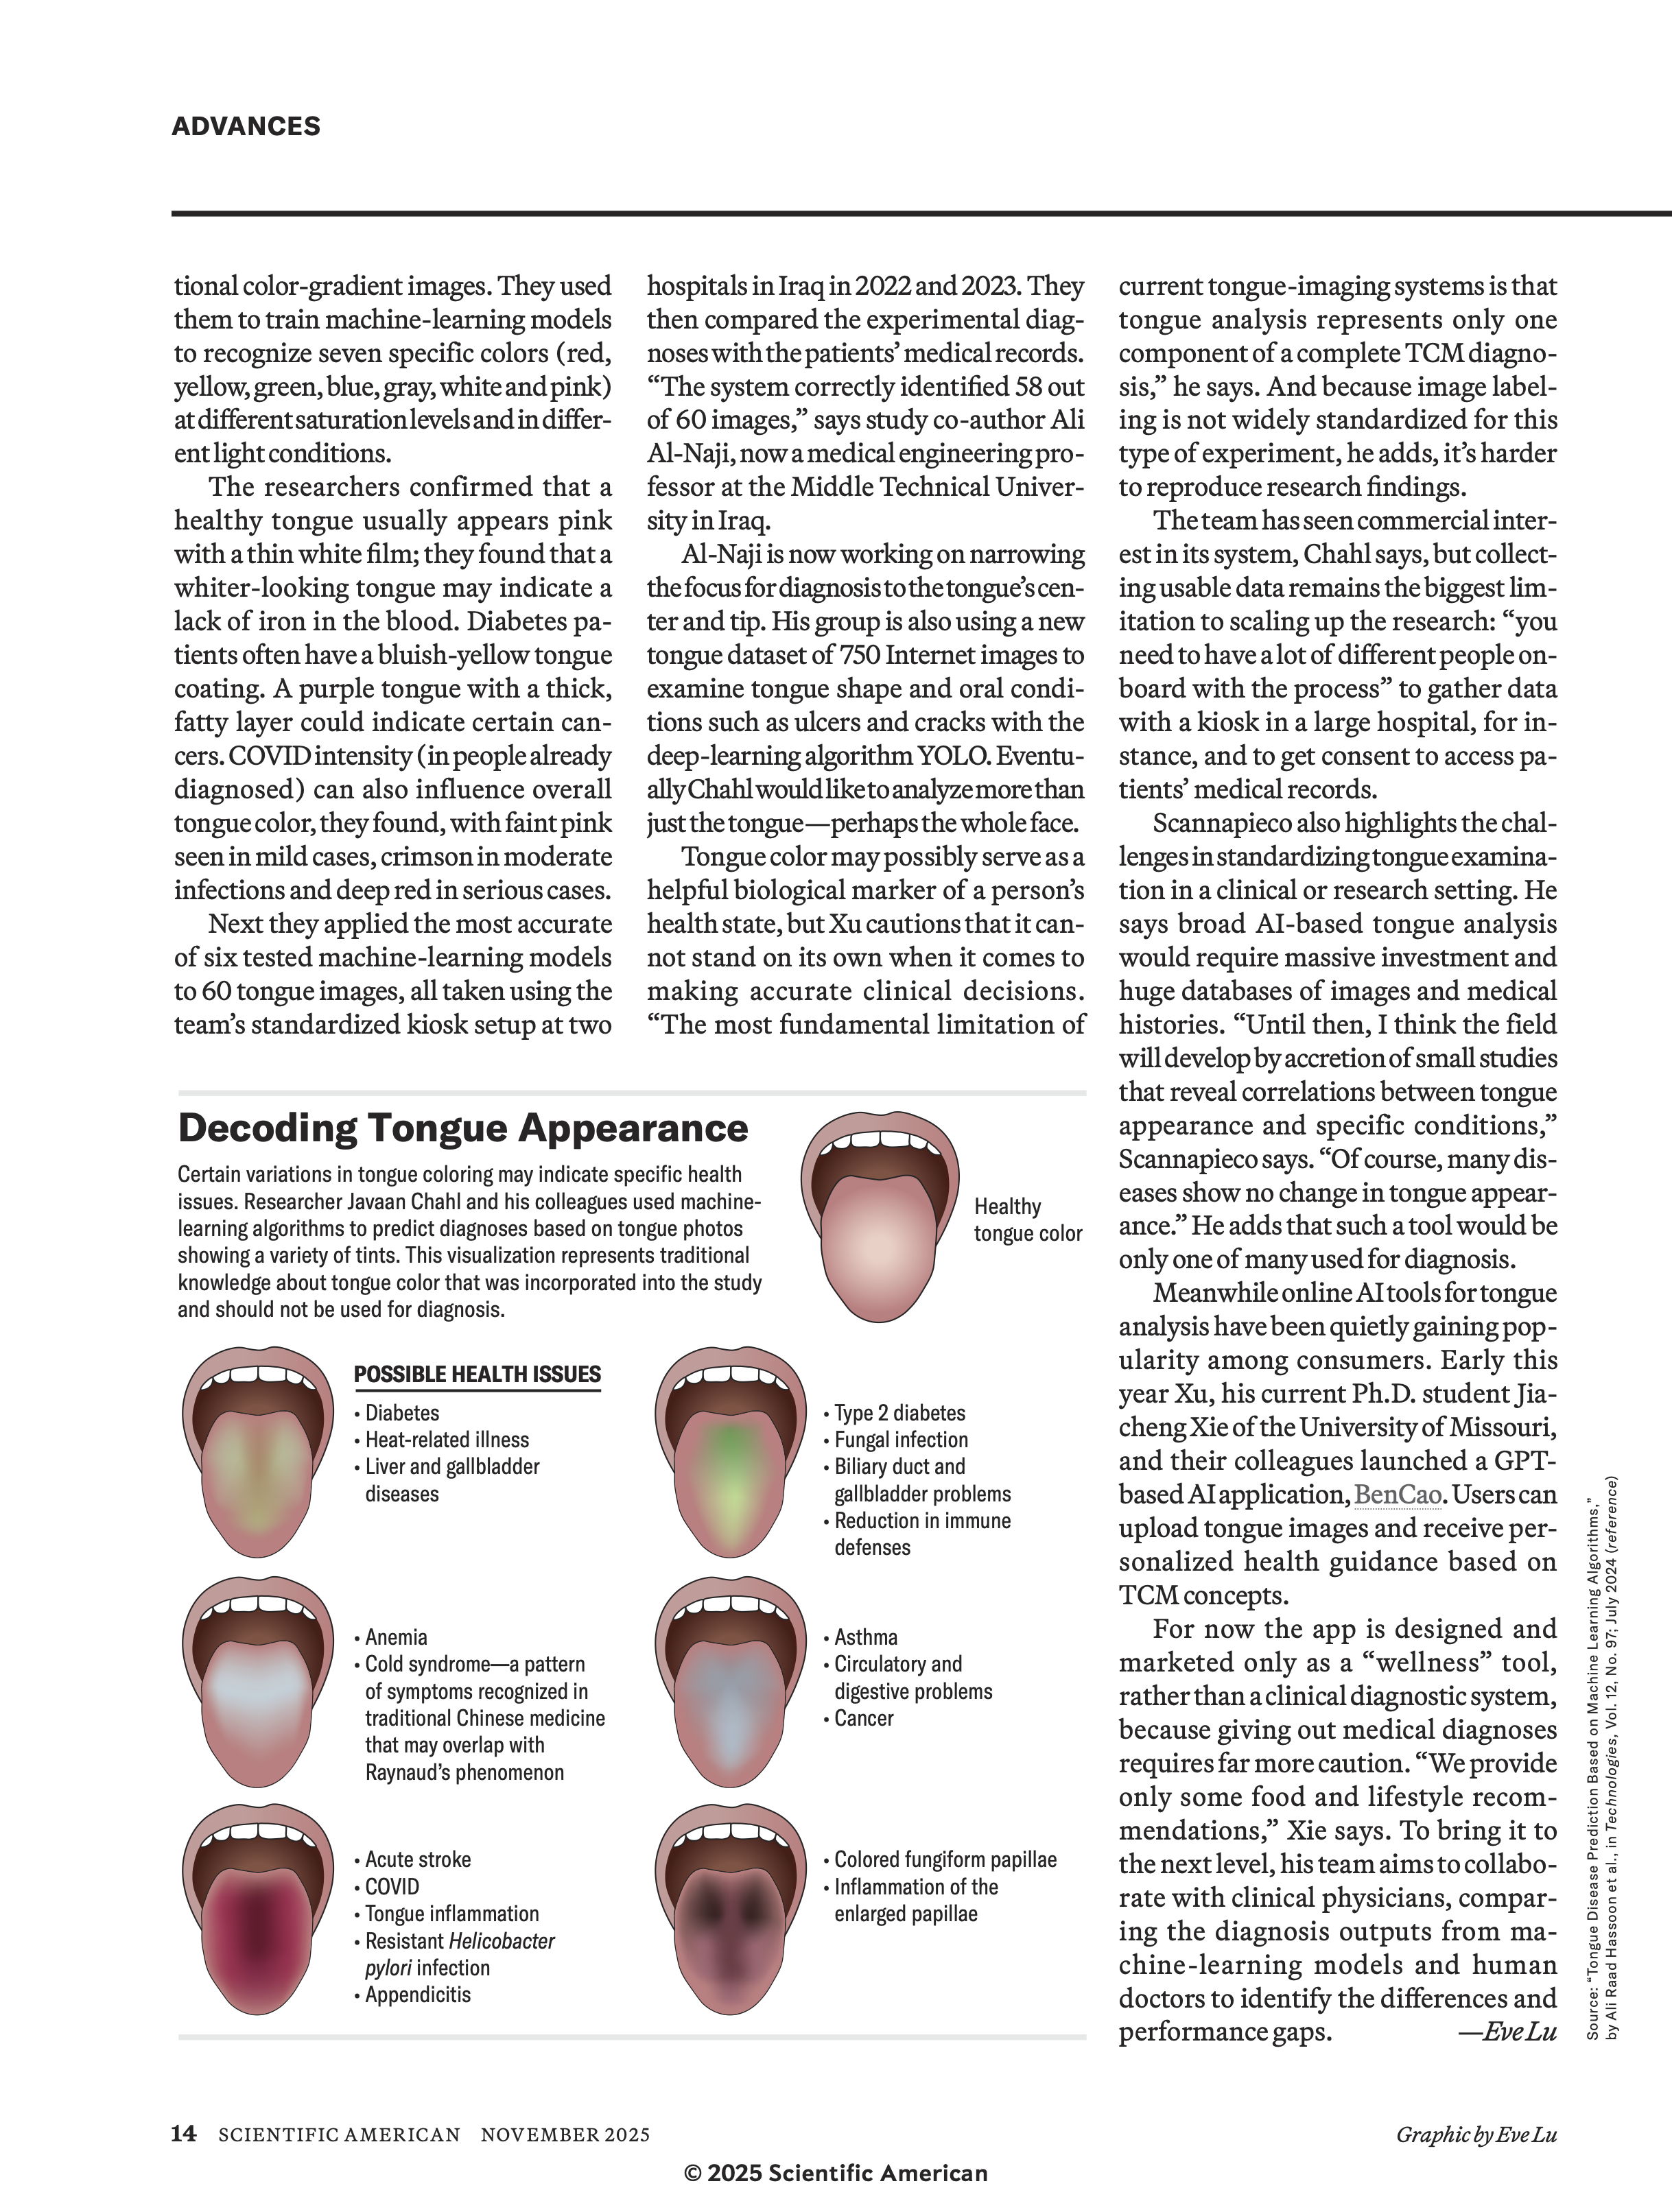
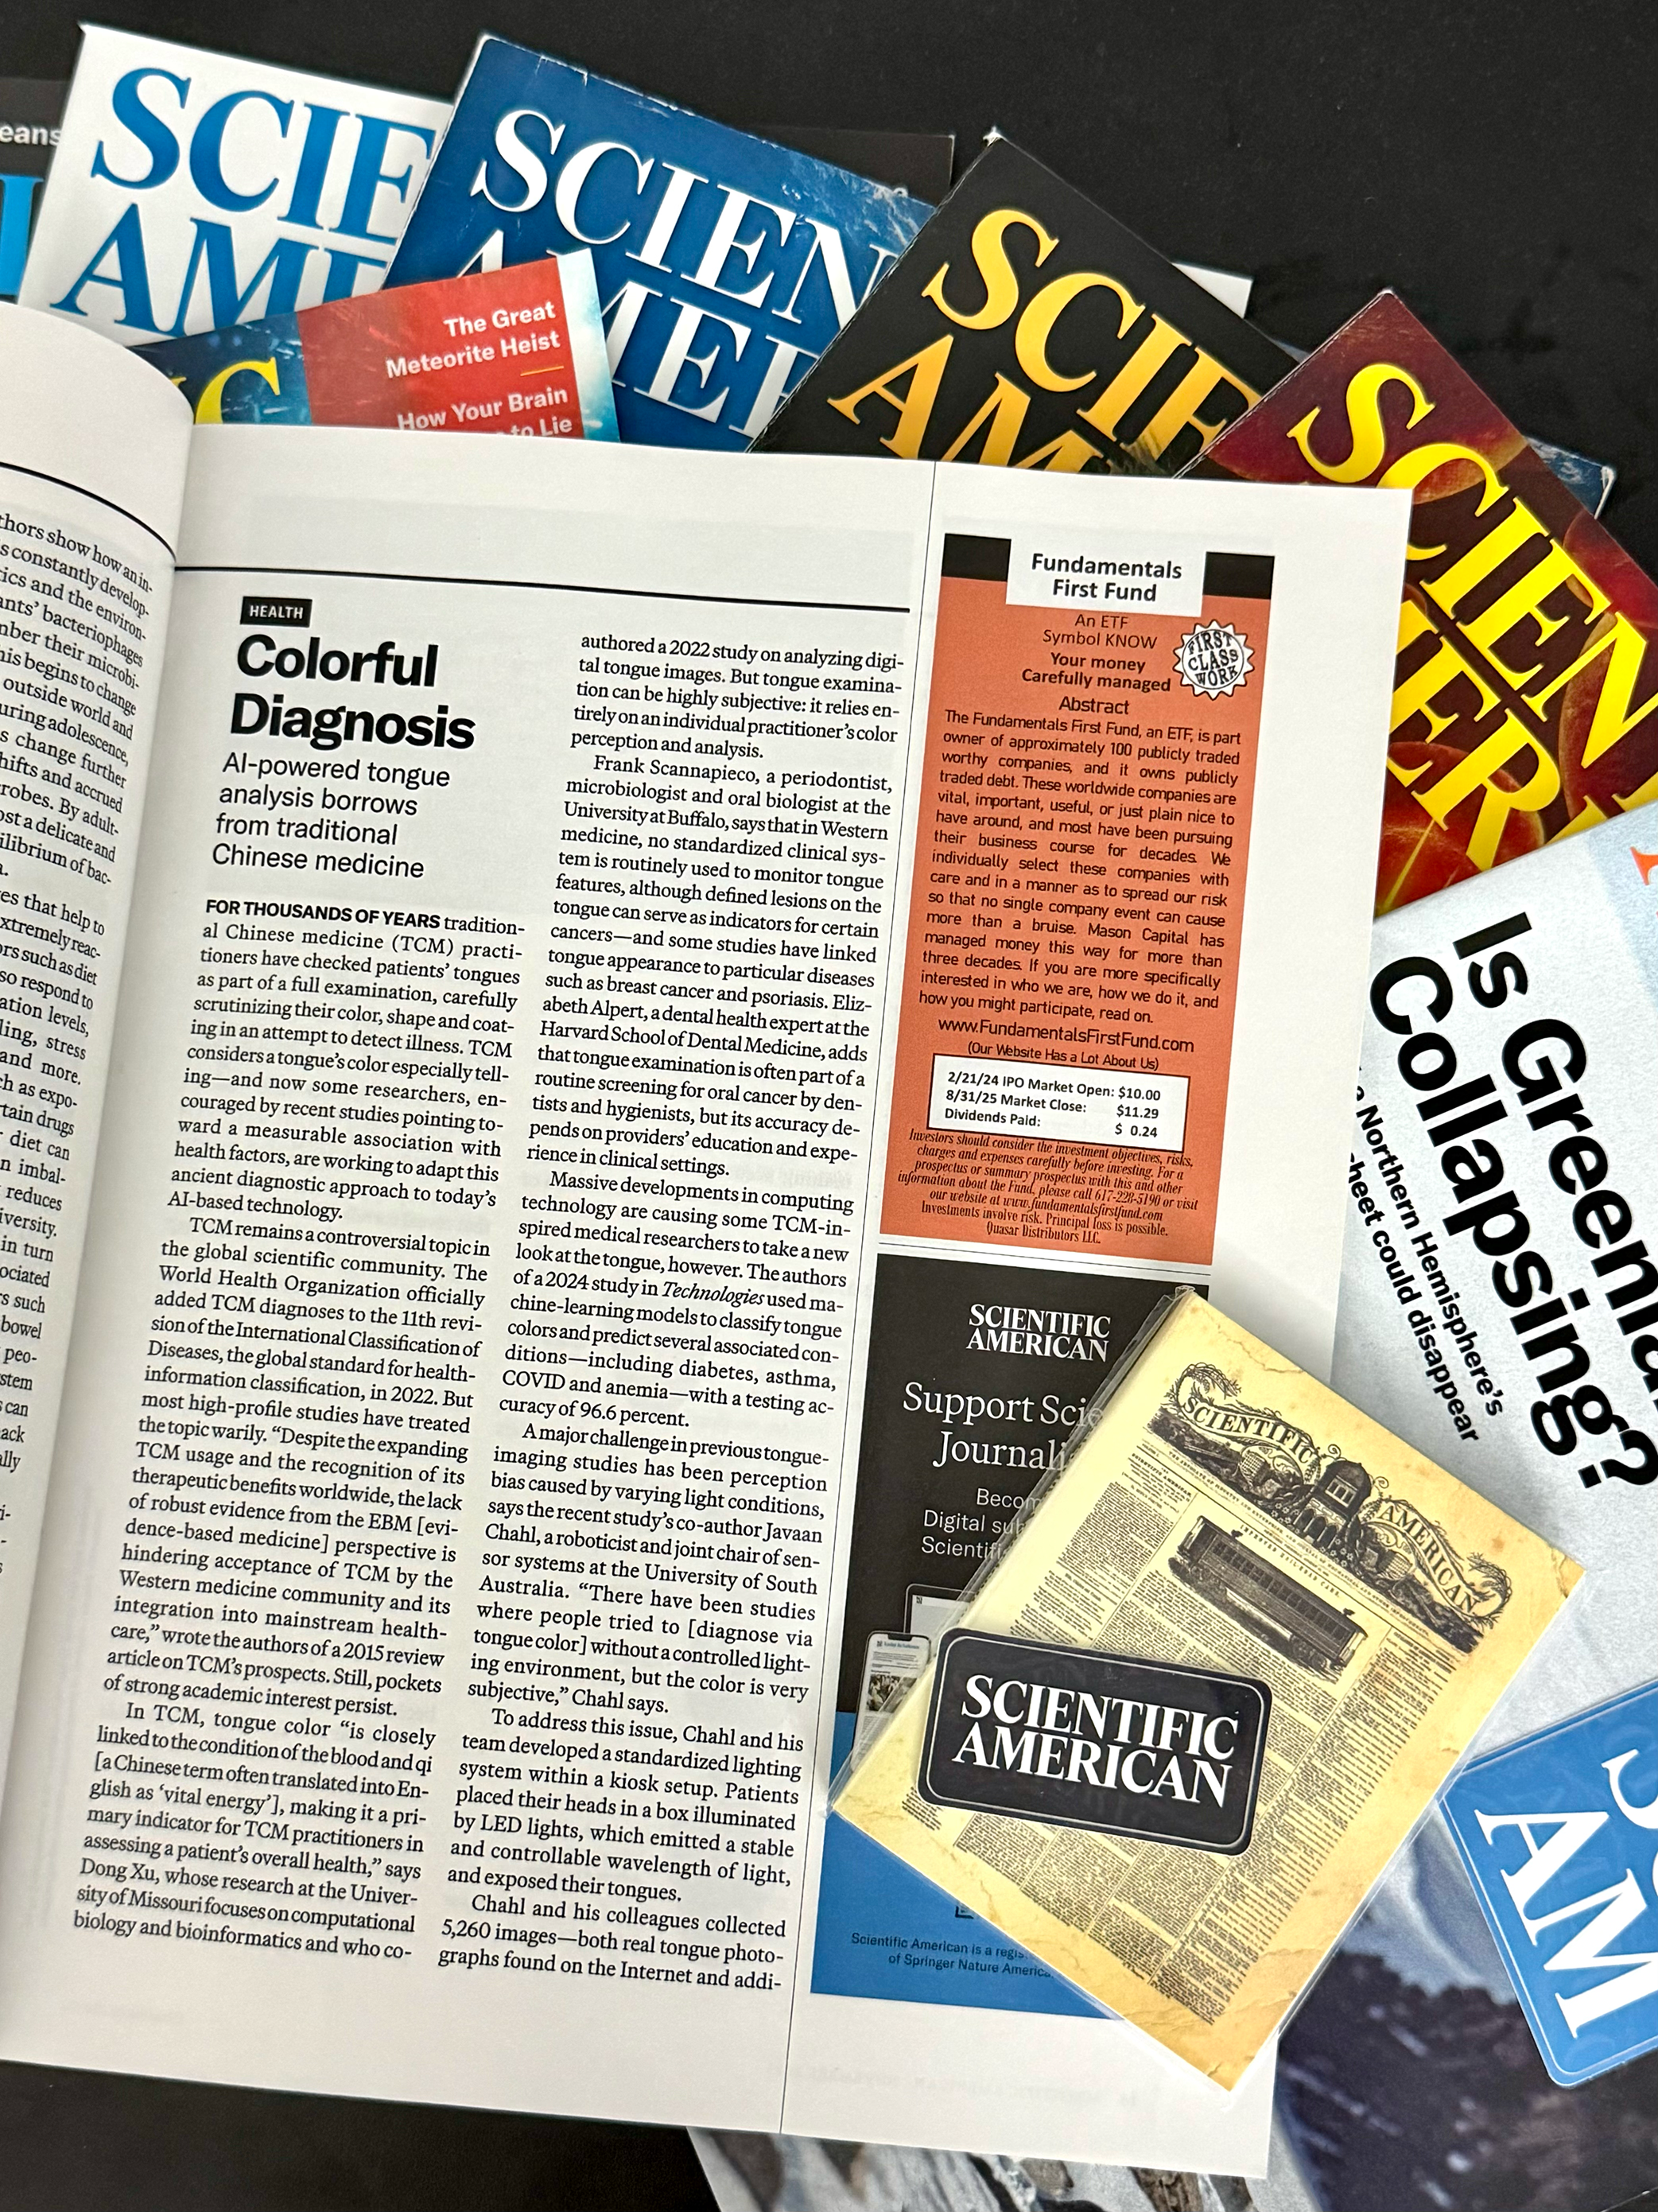
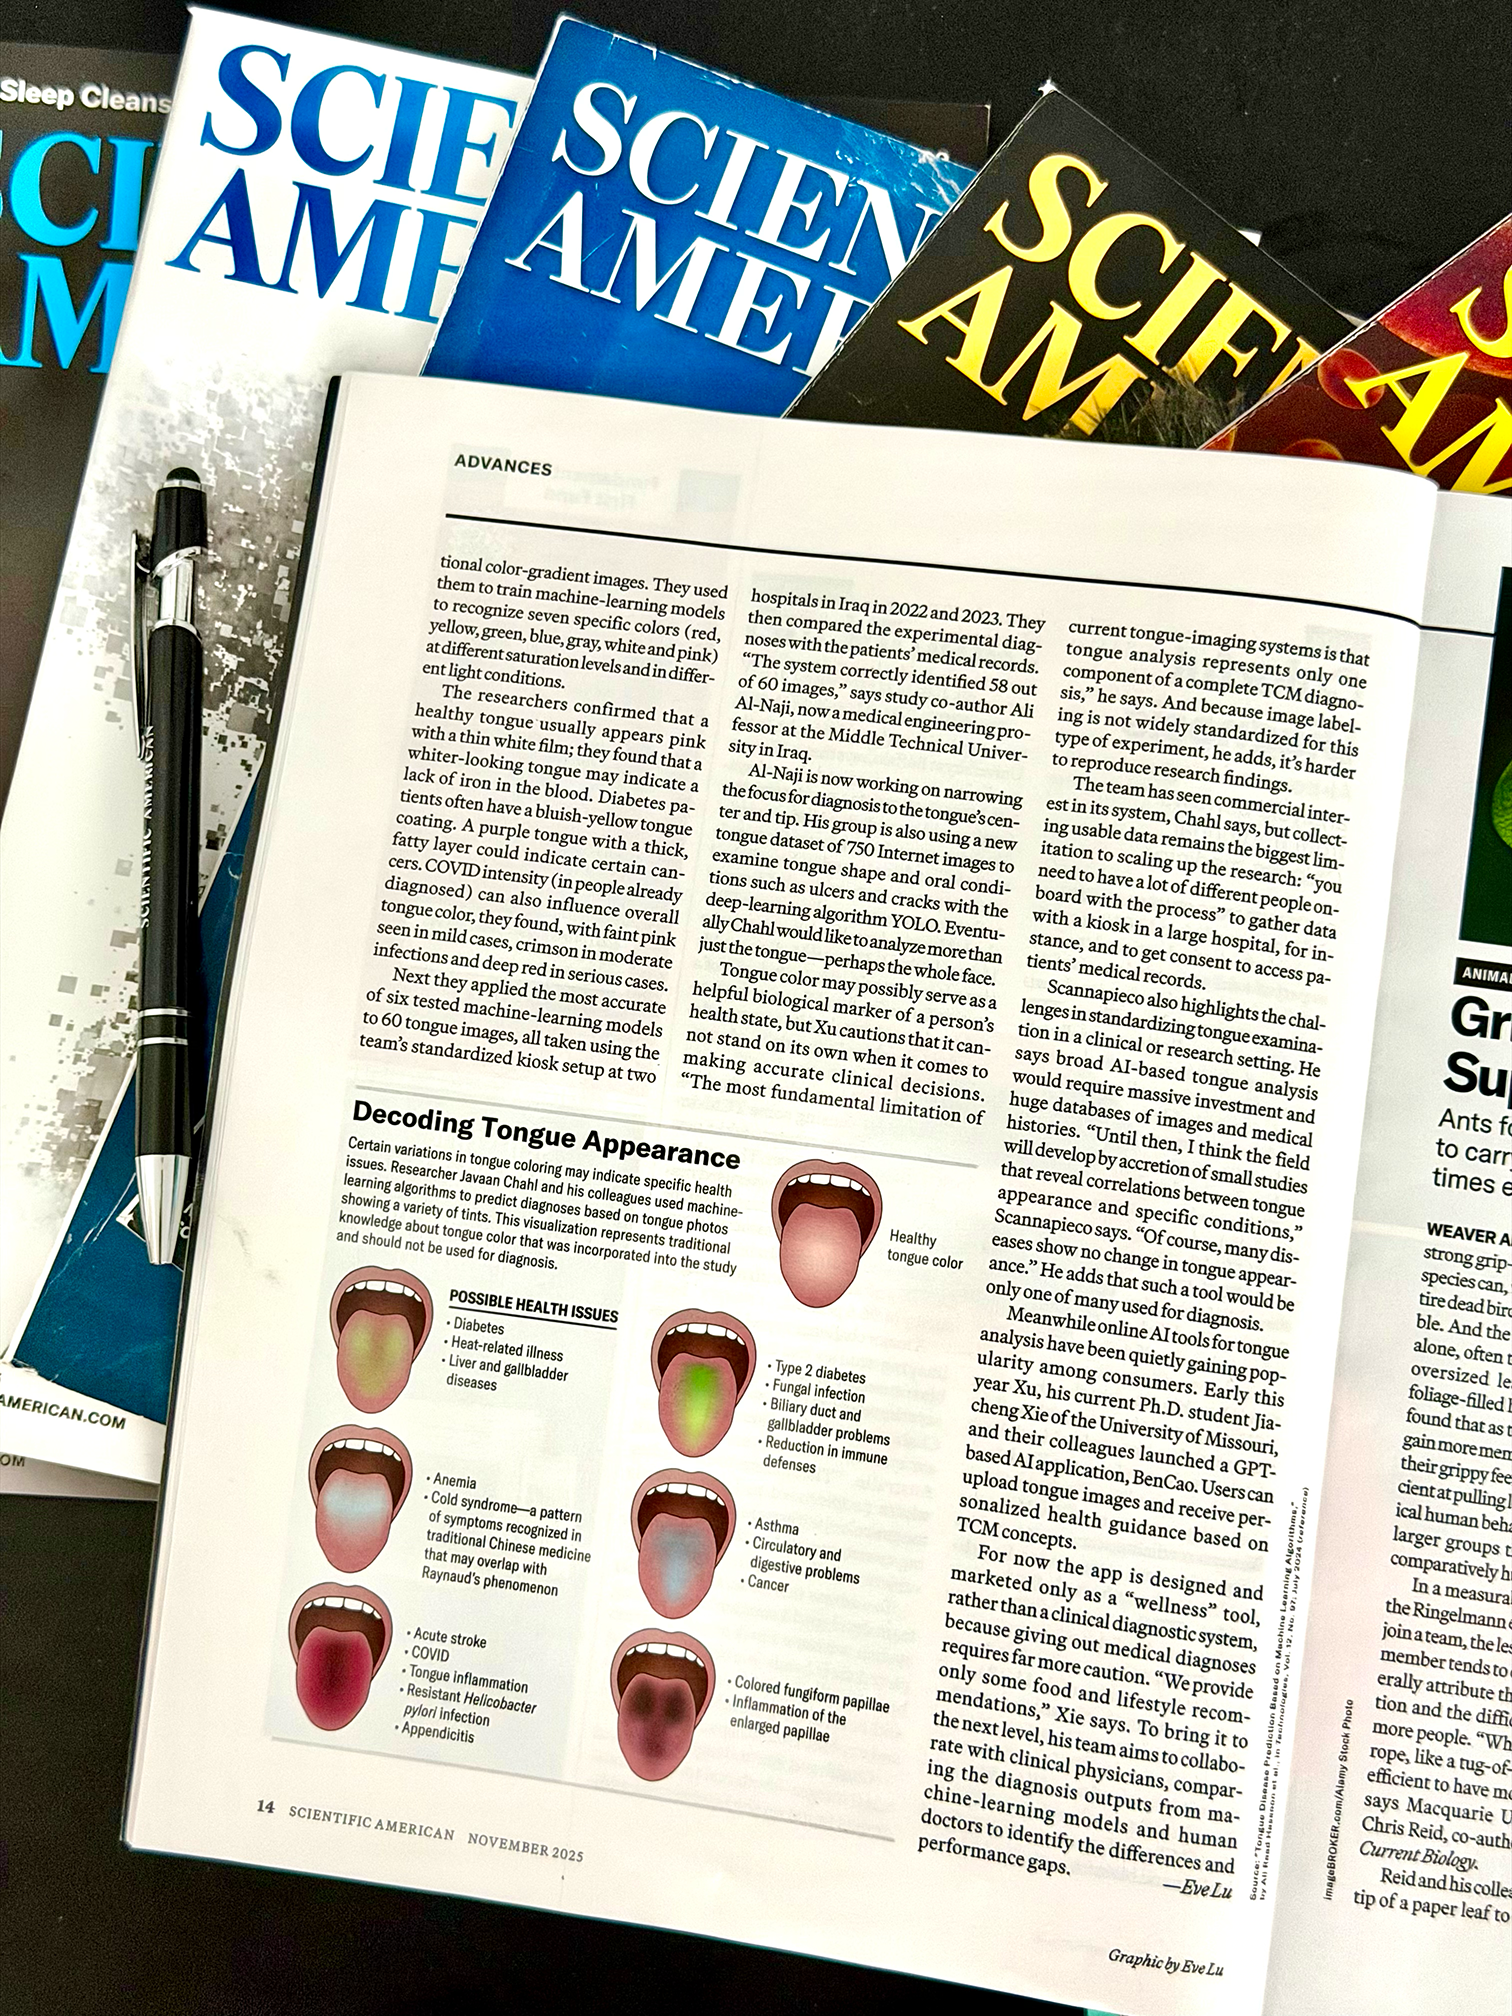
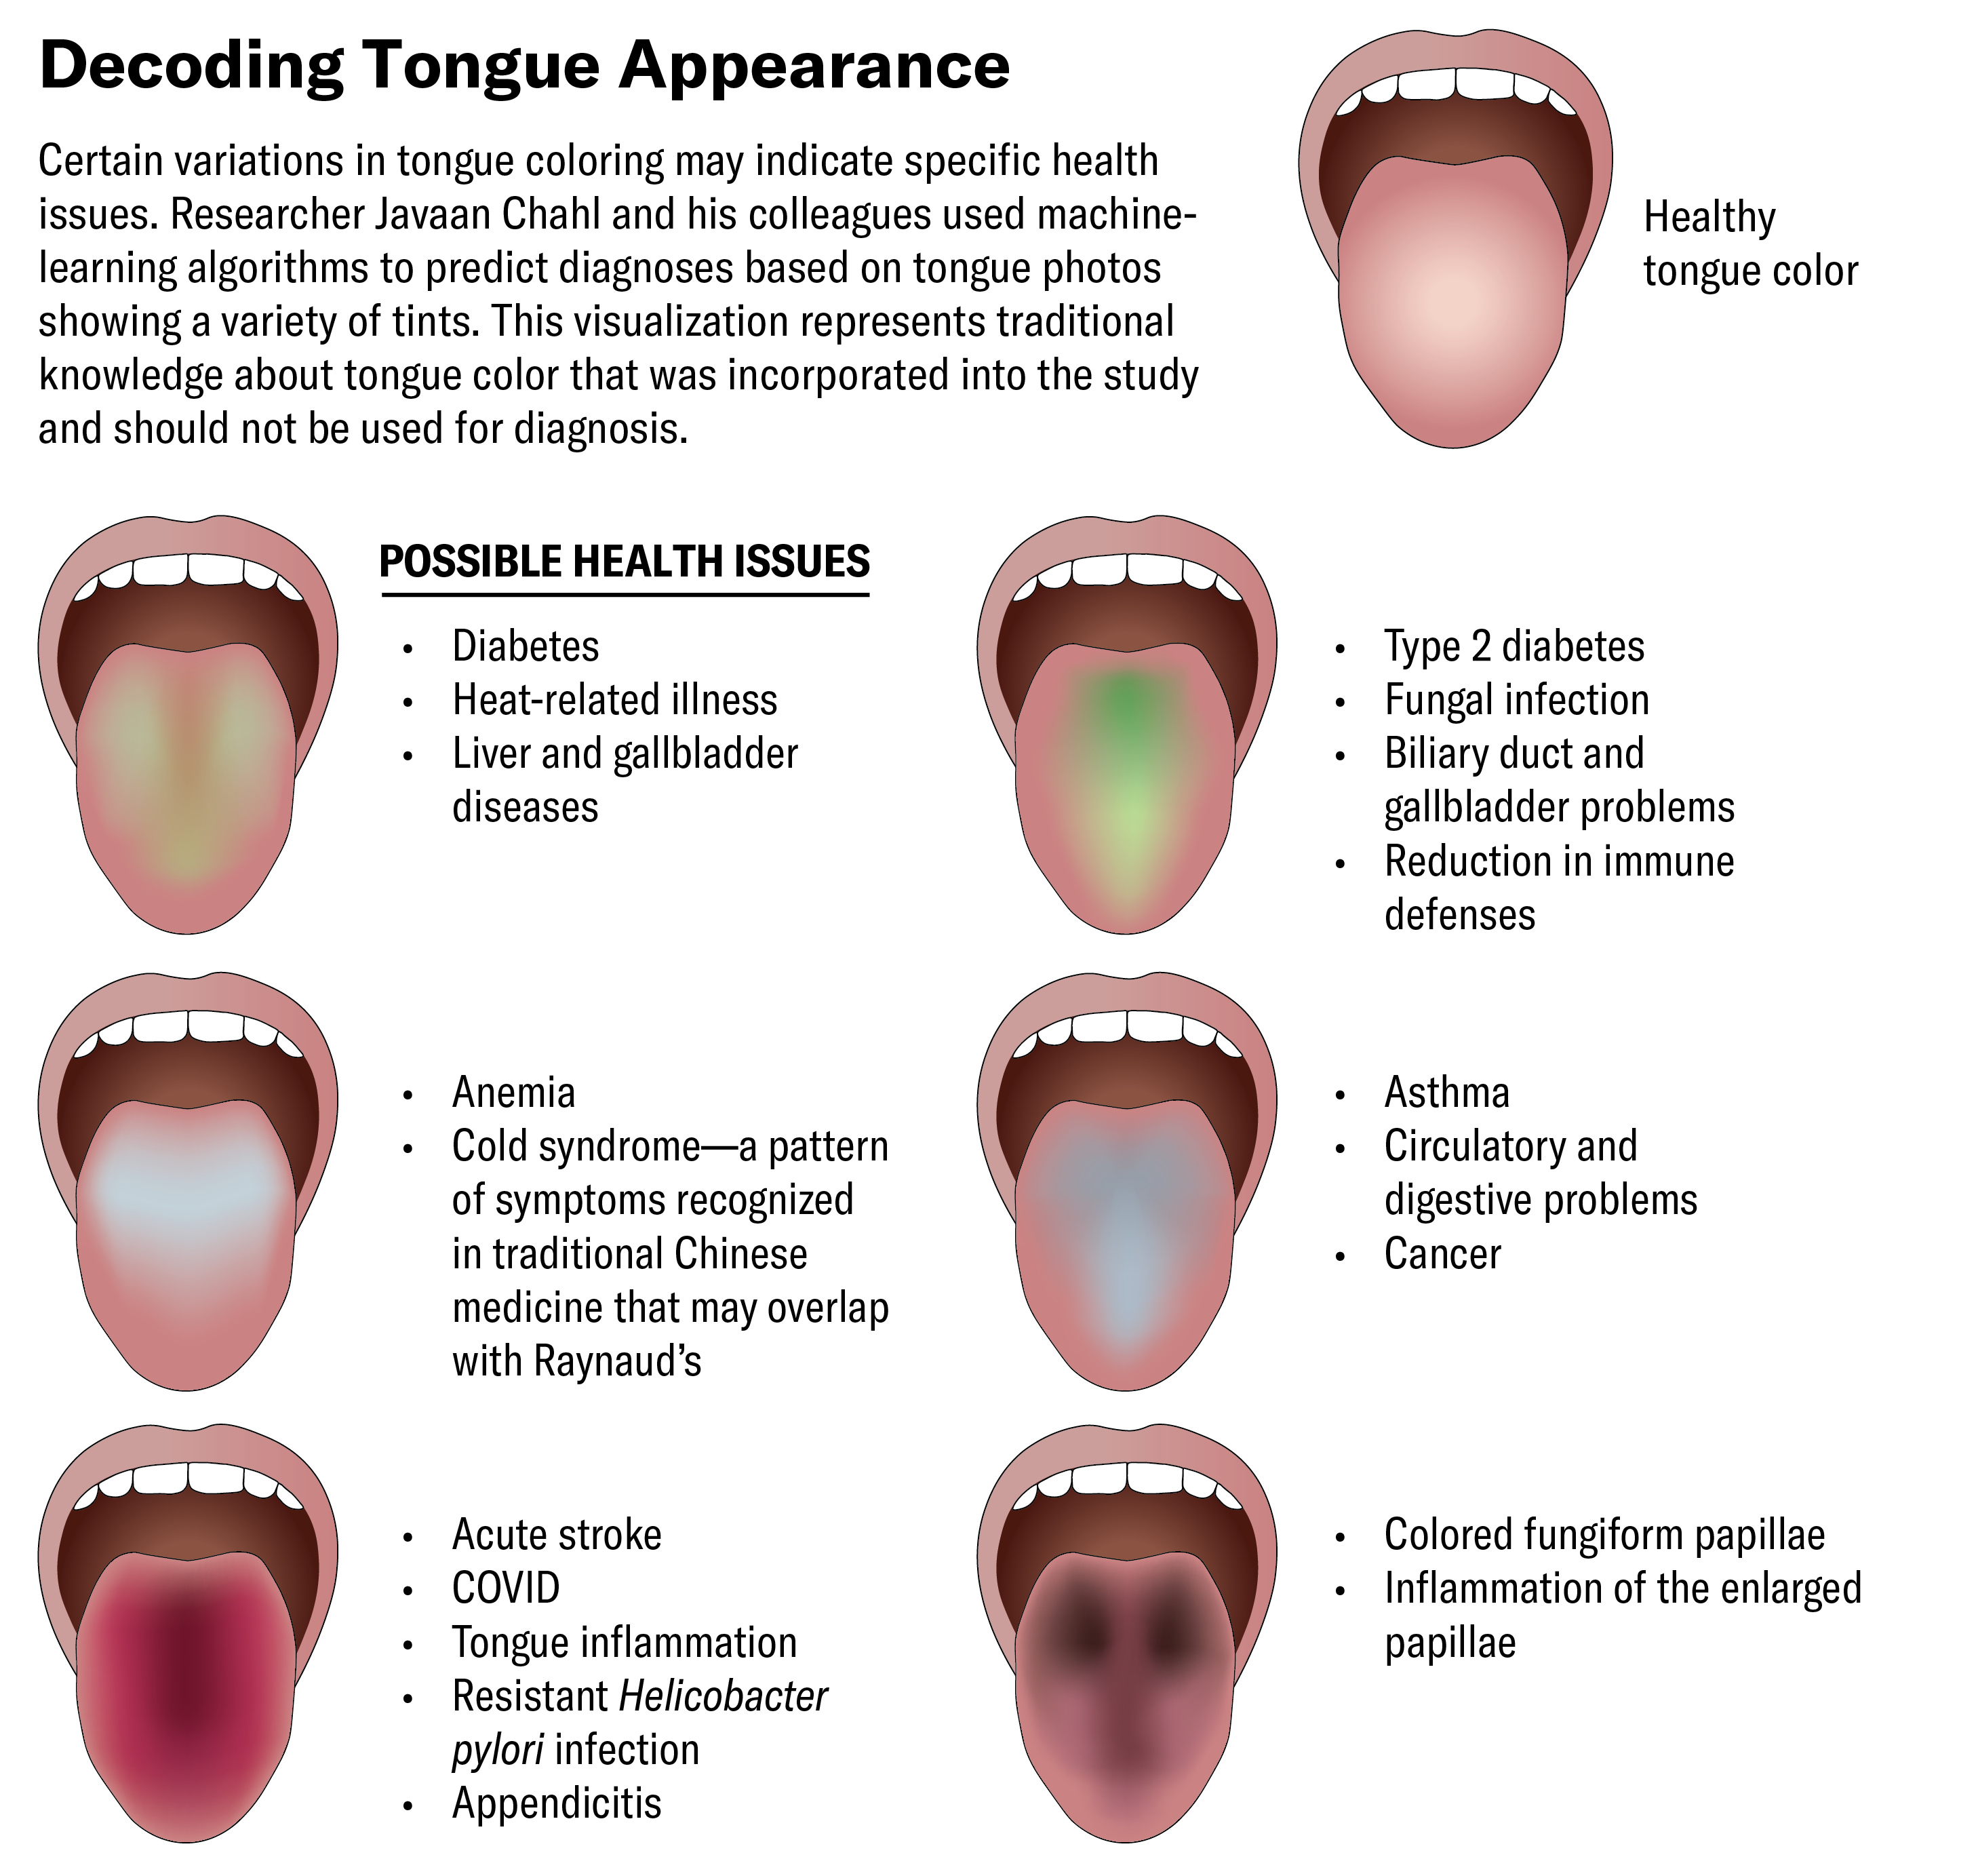
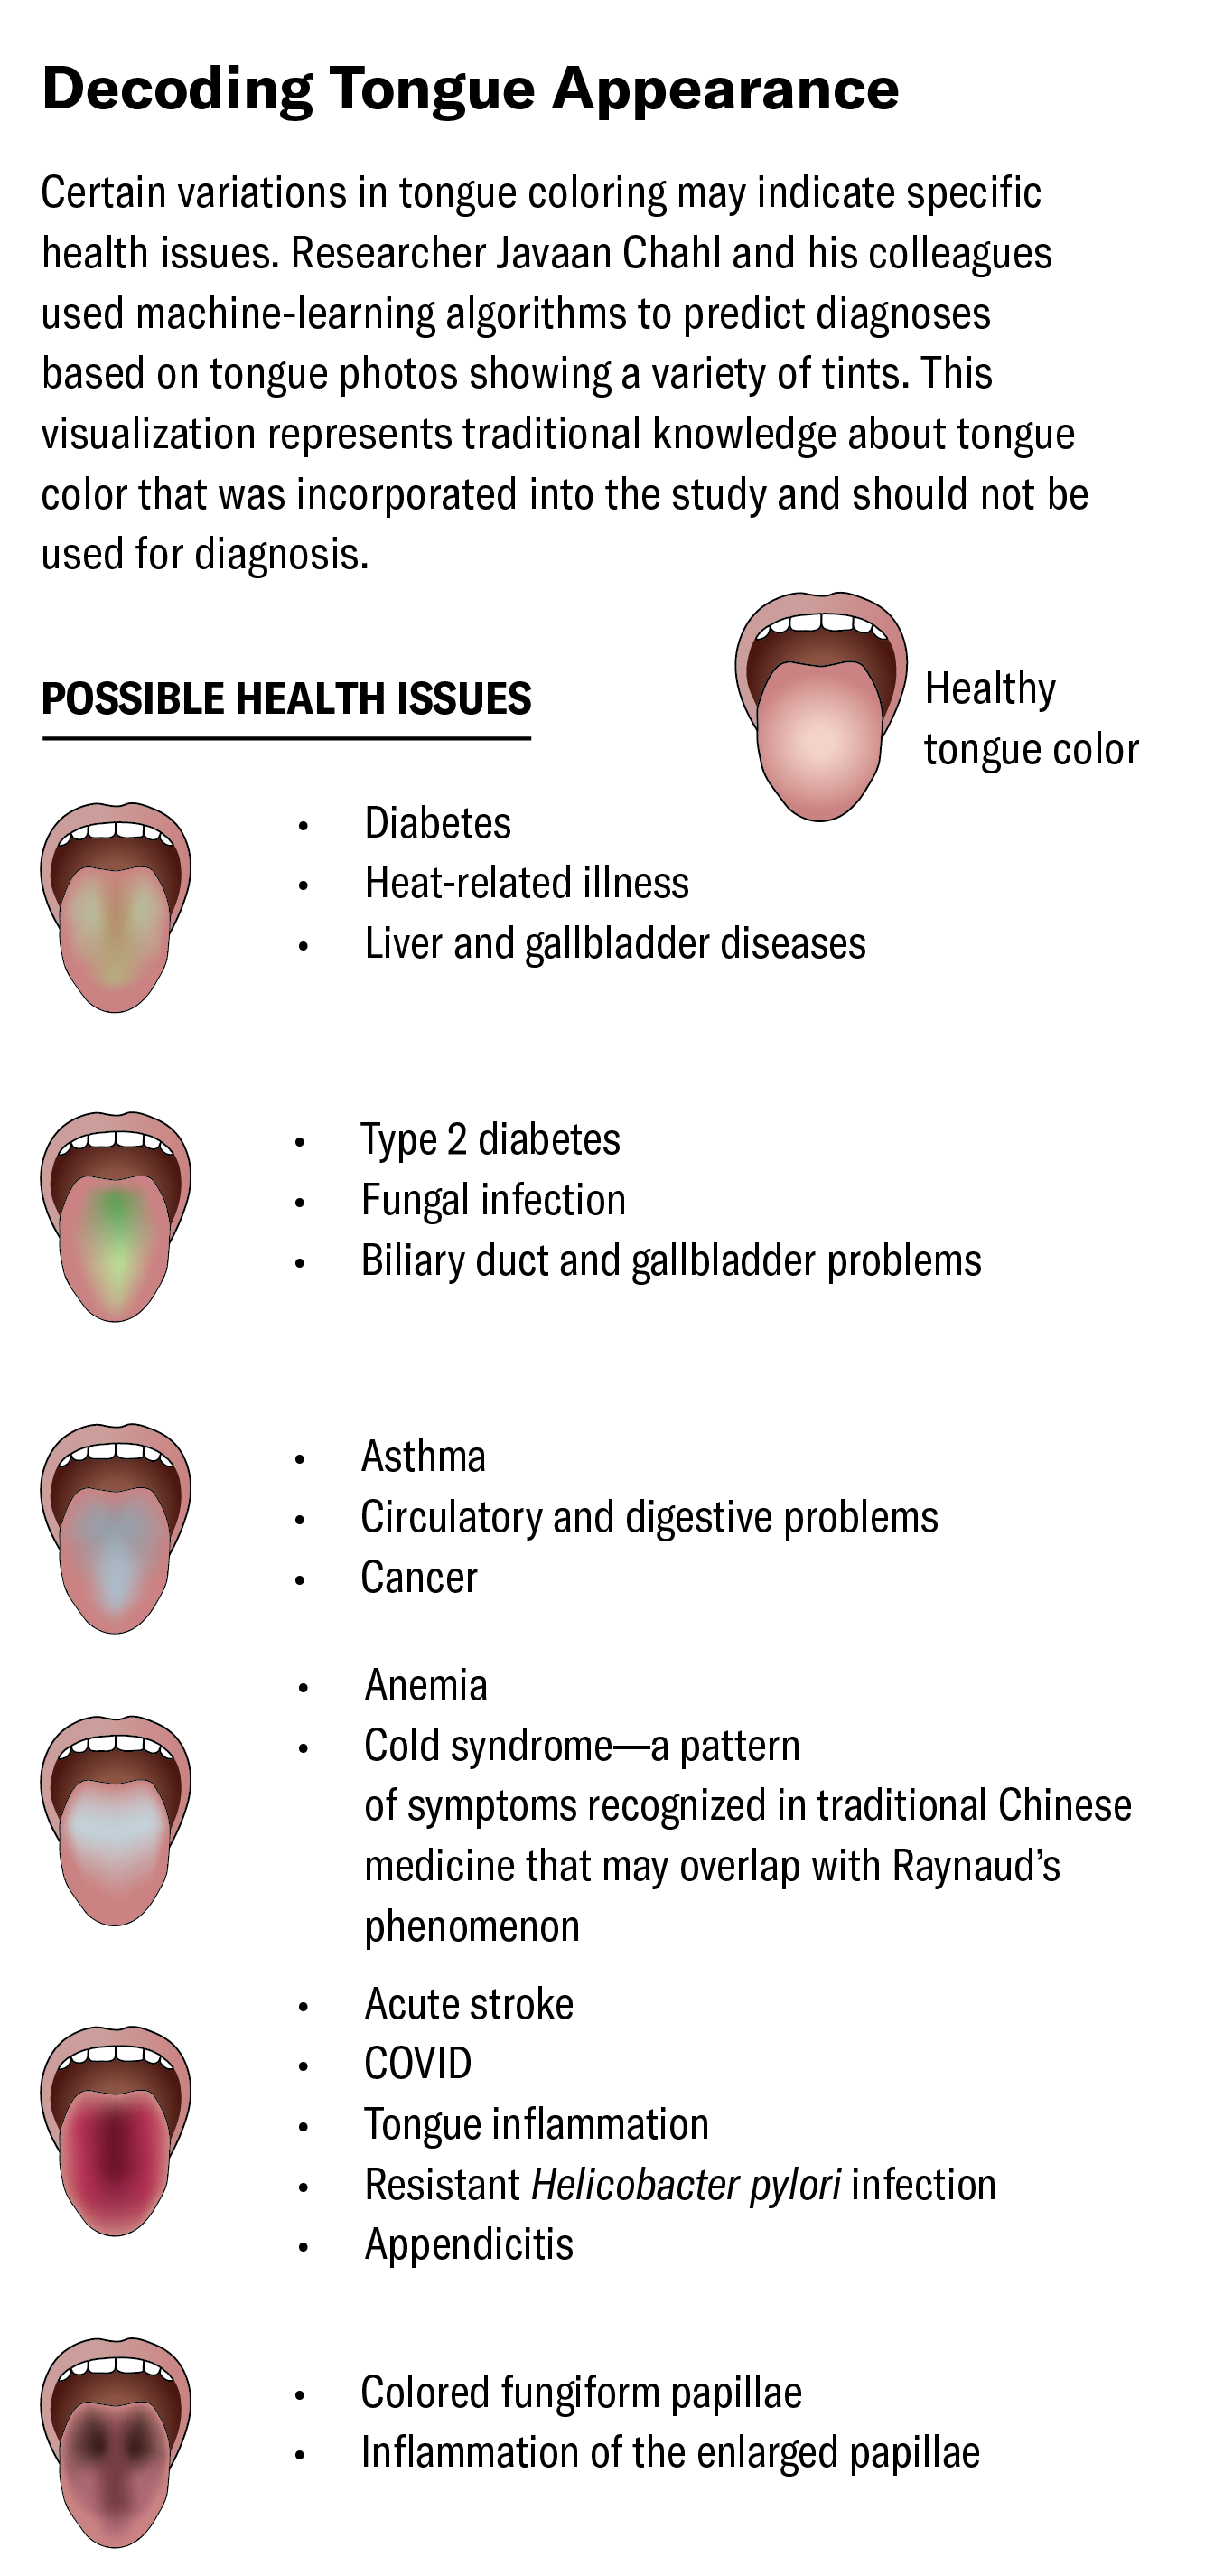
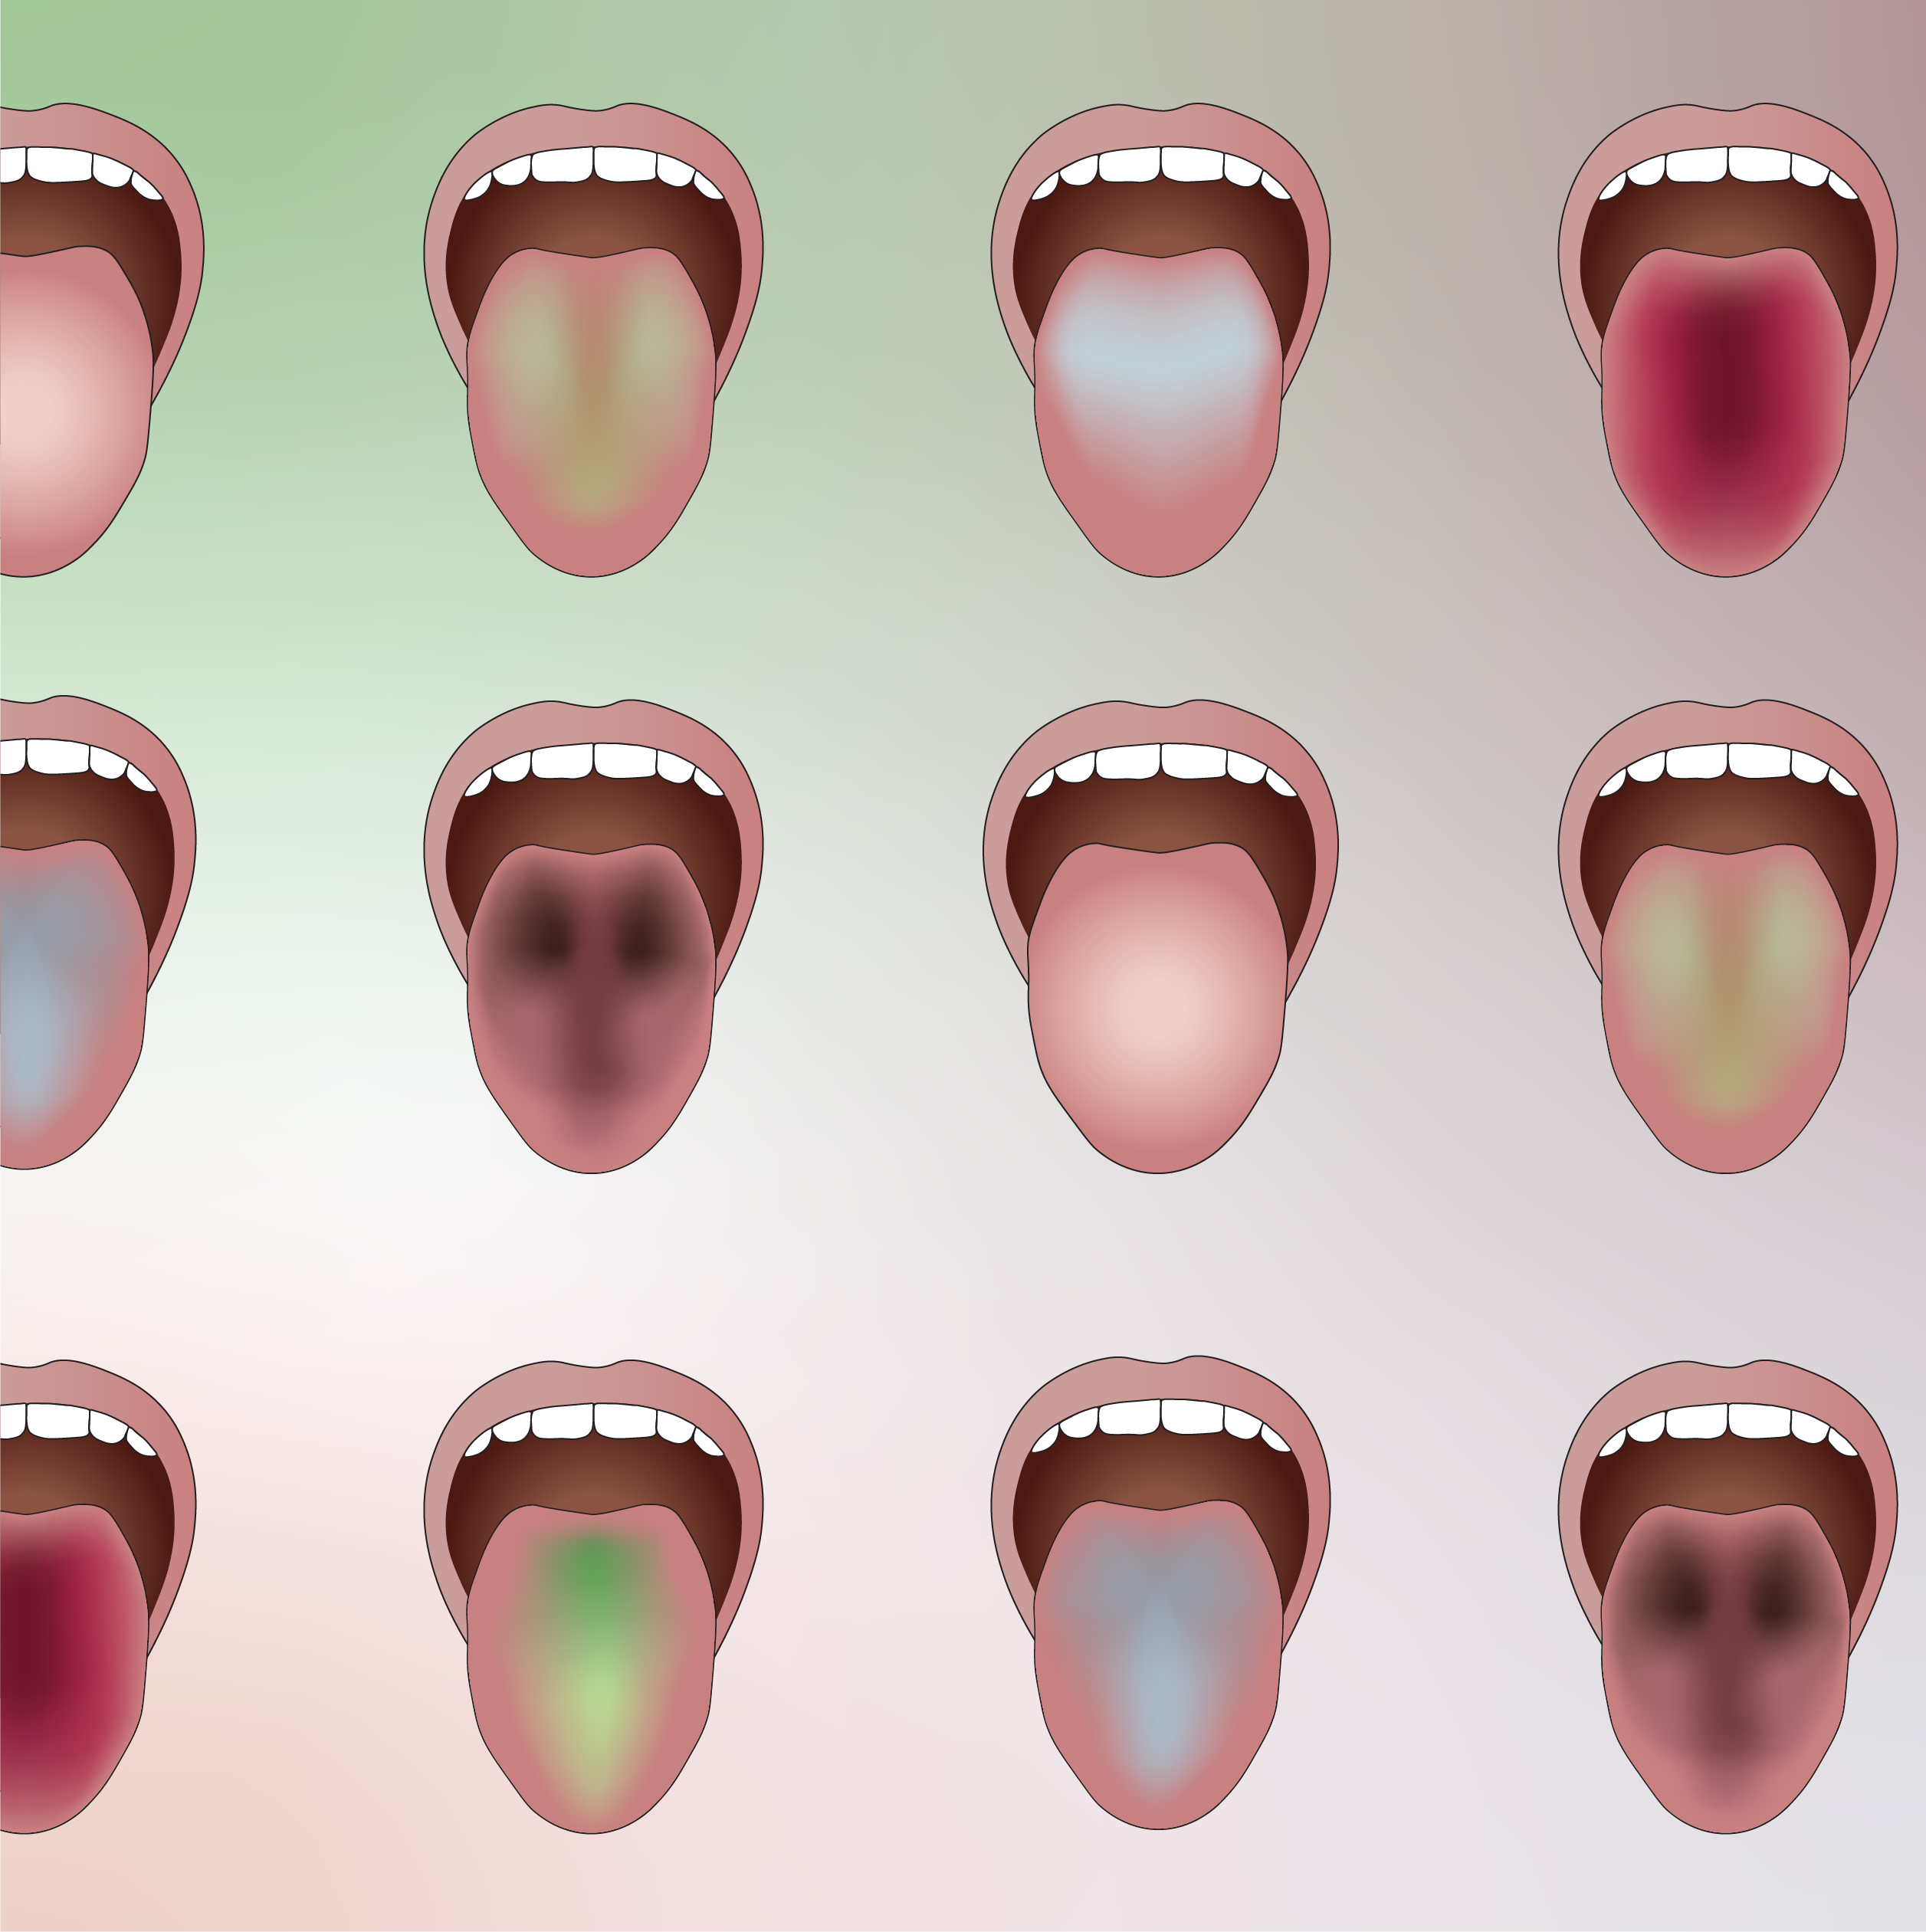
My first solo byline for a Scientific American story AI Reads Your Tongue Color to Reveal Hidden Diseases, edited by Sarah Lewin Frasier and Dean Visser (text) and Amanda Montañez (graphics), is published in the November 2025 print issue as part of the magazine's Advances coverage. I reported and created graphics for the piece, which is now live online too.
The story looks at a study where researchers trained machine-learning models on thousands of tongue images to classify colors and predict conditions such as diabetes, COVID-19, and anemia, achieving diagnostic accuracy over 96%.
I spoke with the research team about reducing color-perception bias from lighting variations, validating results against hospital records, and how modern AI bioengineering is beginning to speaking with ideas inspired by traditional Chinese medicine.
(Click the arrows to read complimentary digital issue and graphics for both desktop and mobile versions)
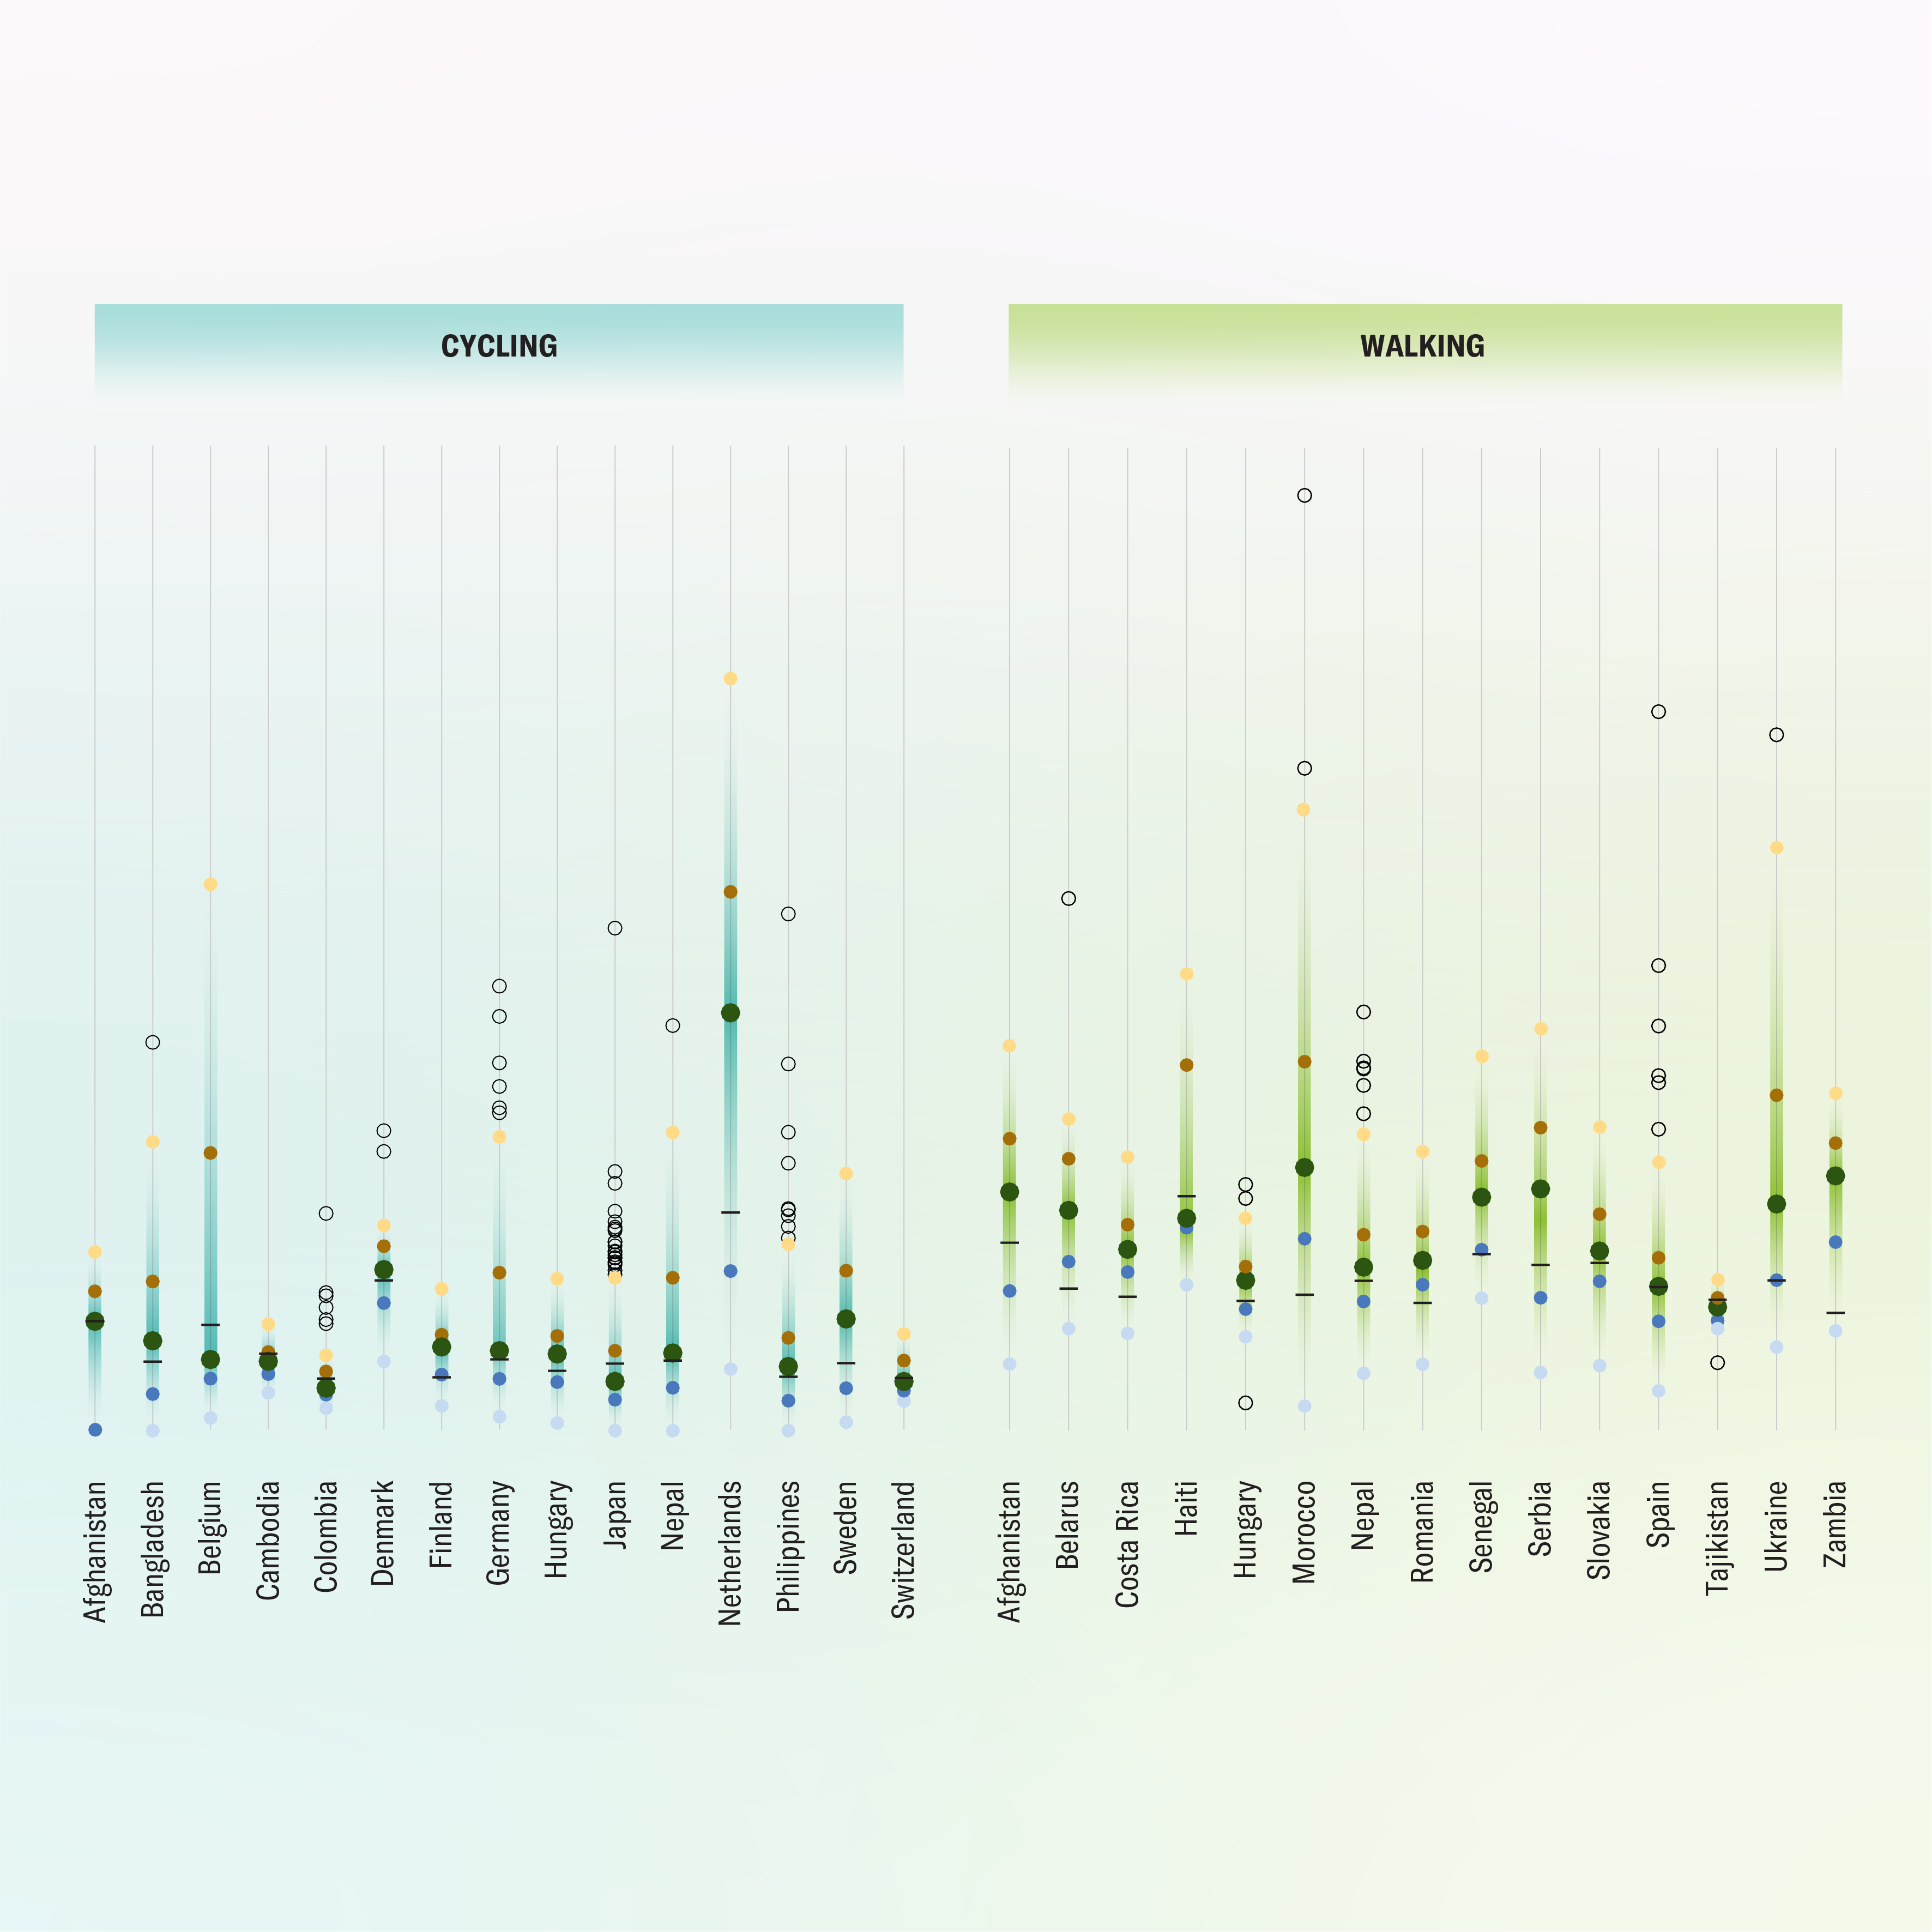
Leg and Pedal
November 2025 • Scientific American
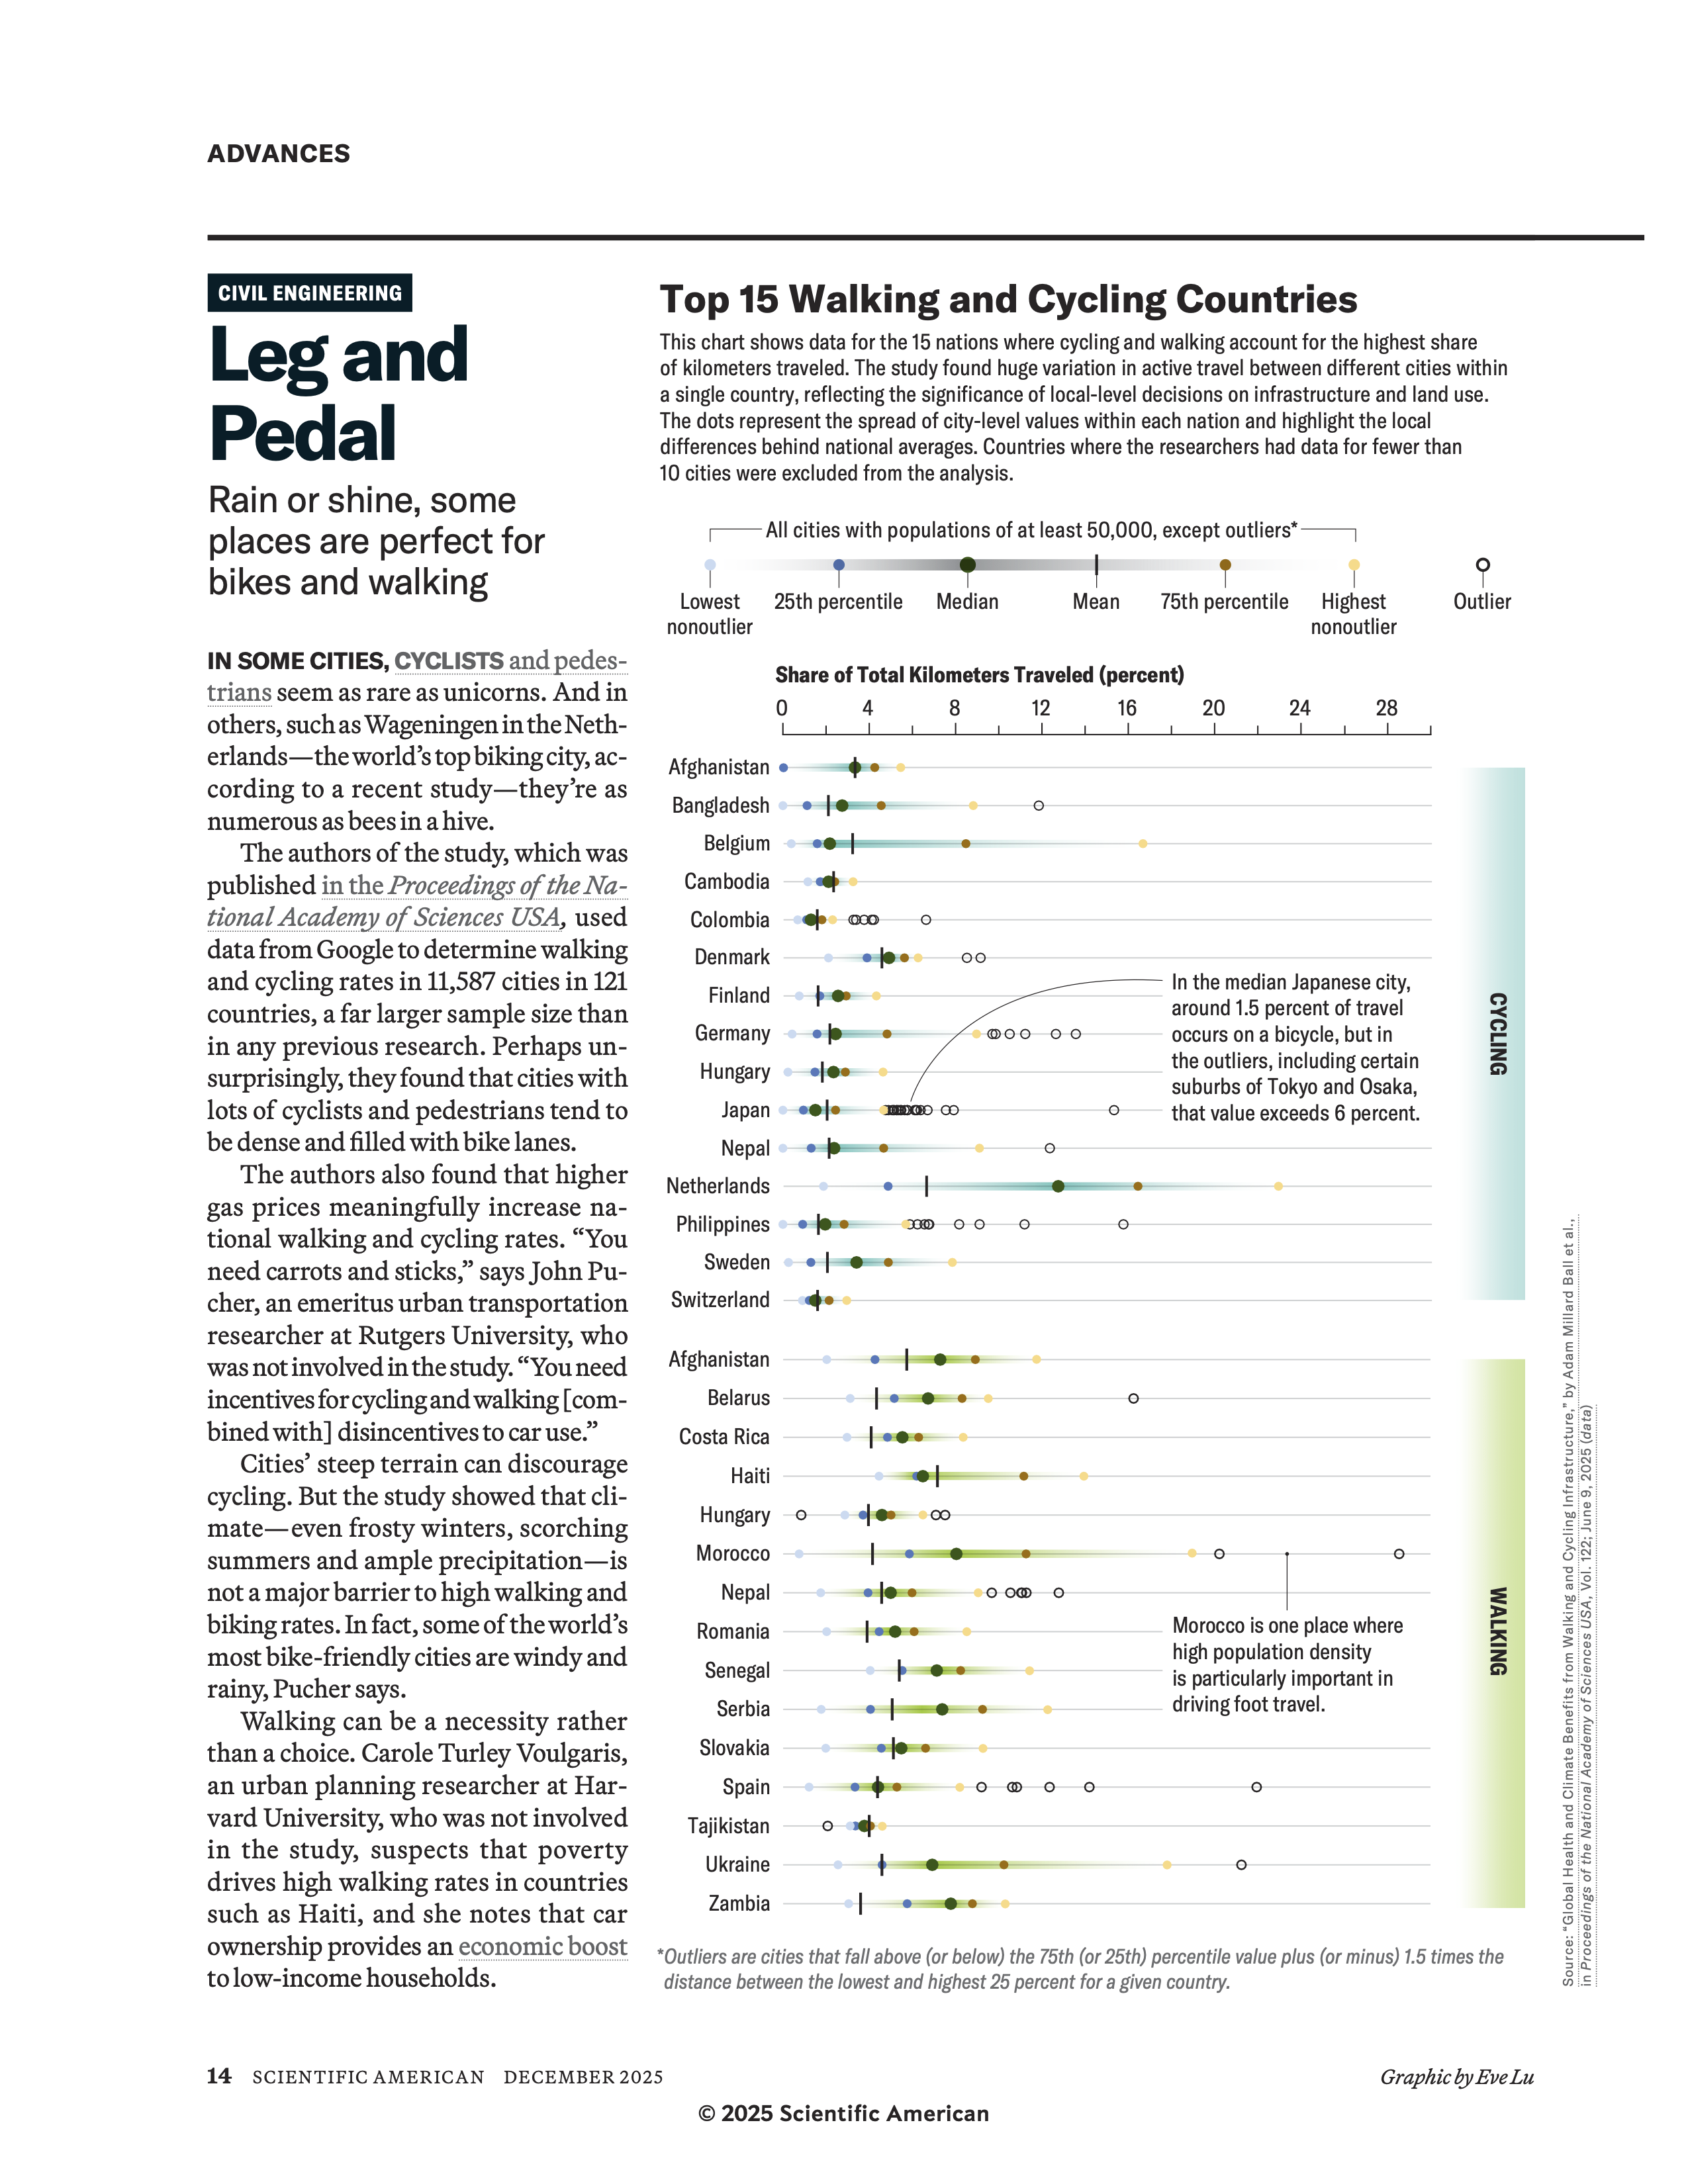
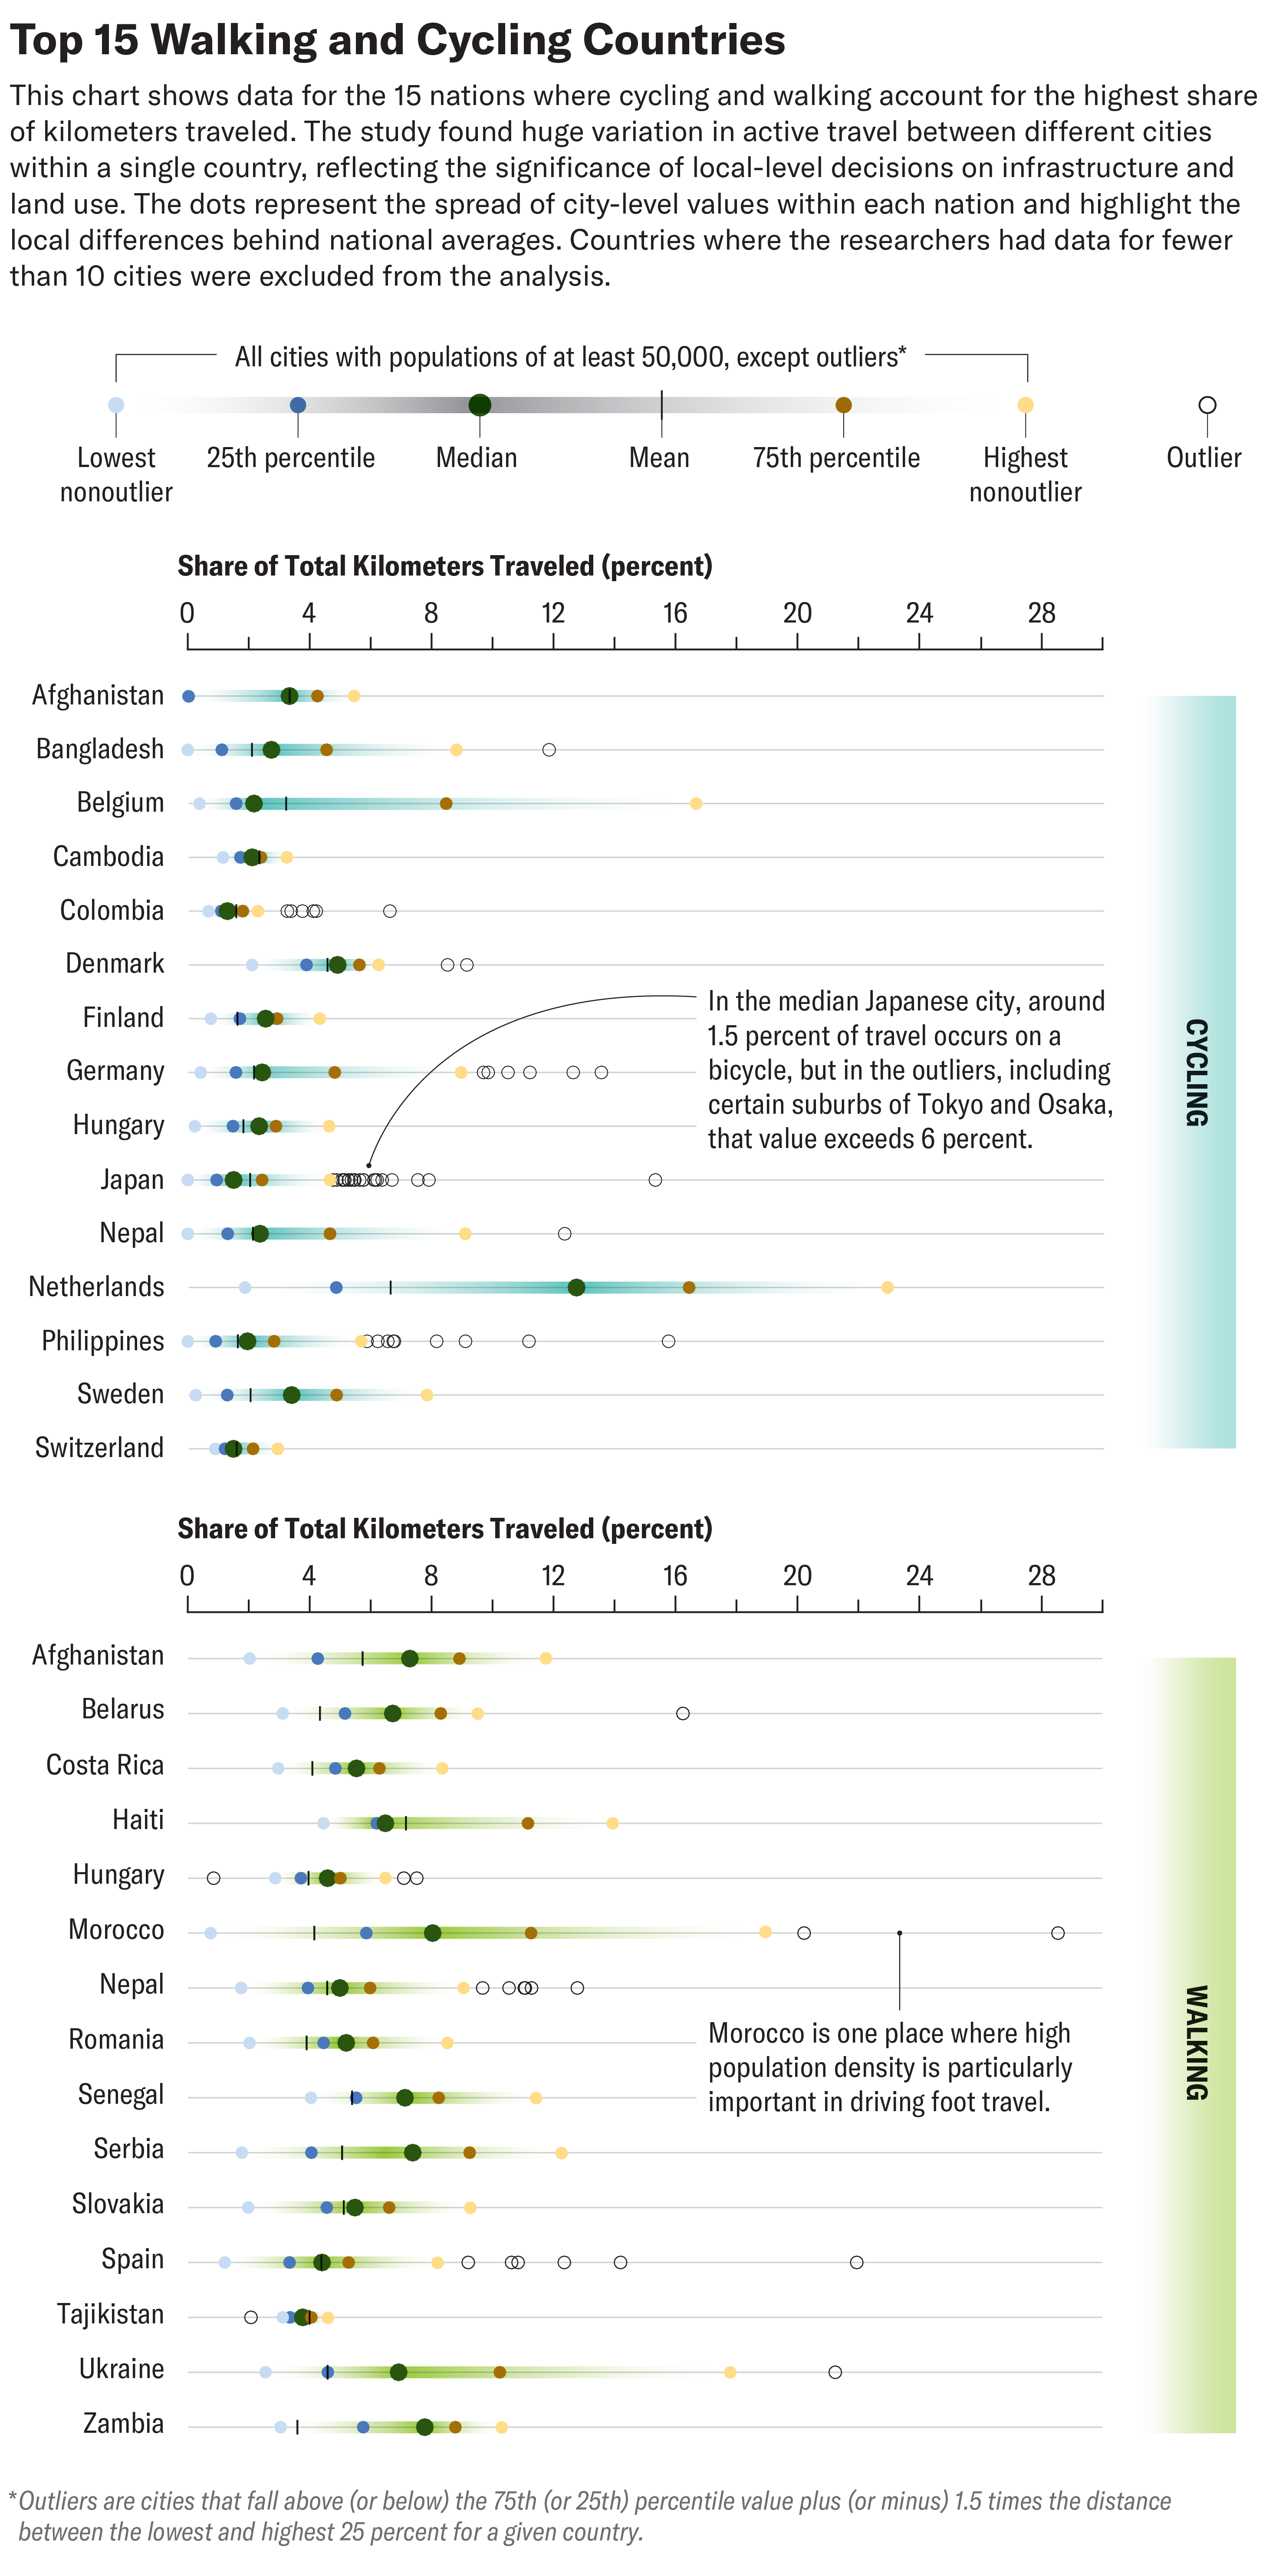
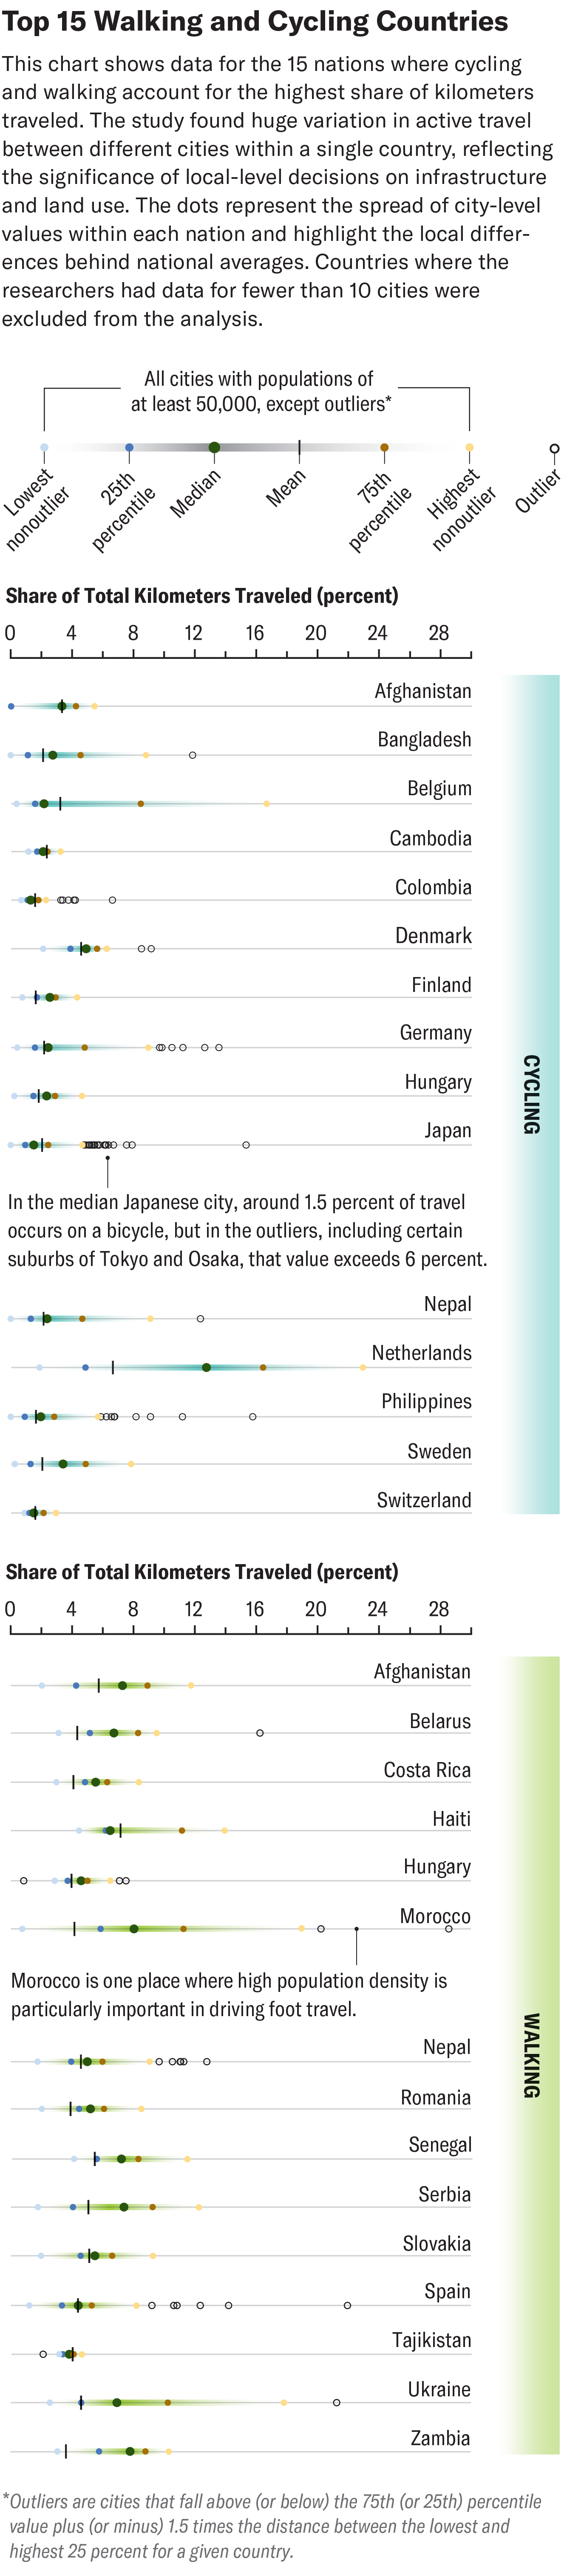
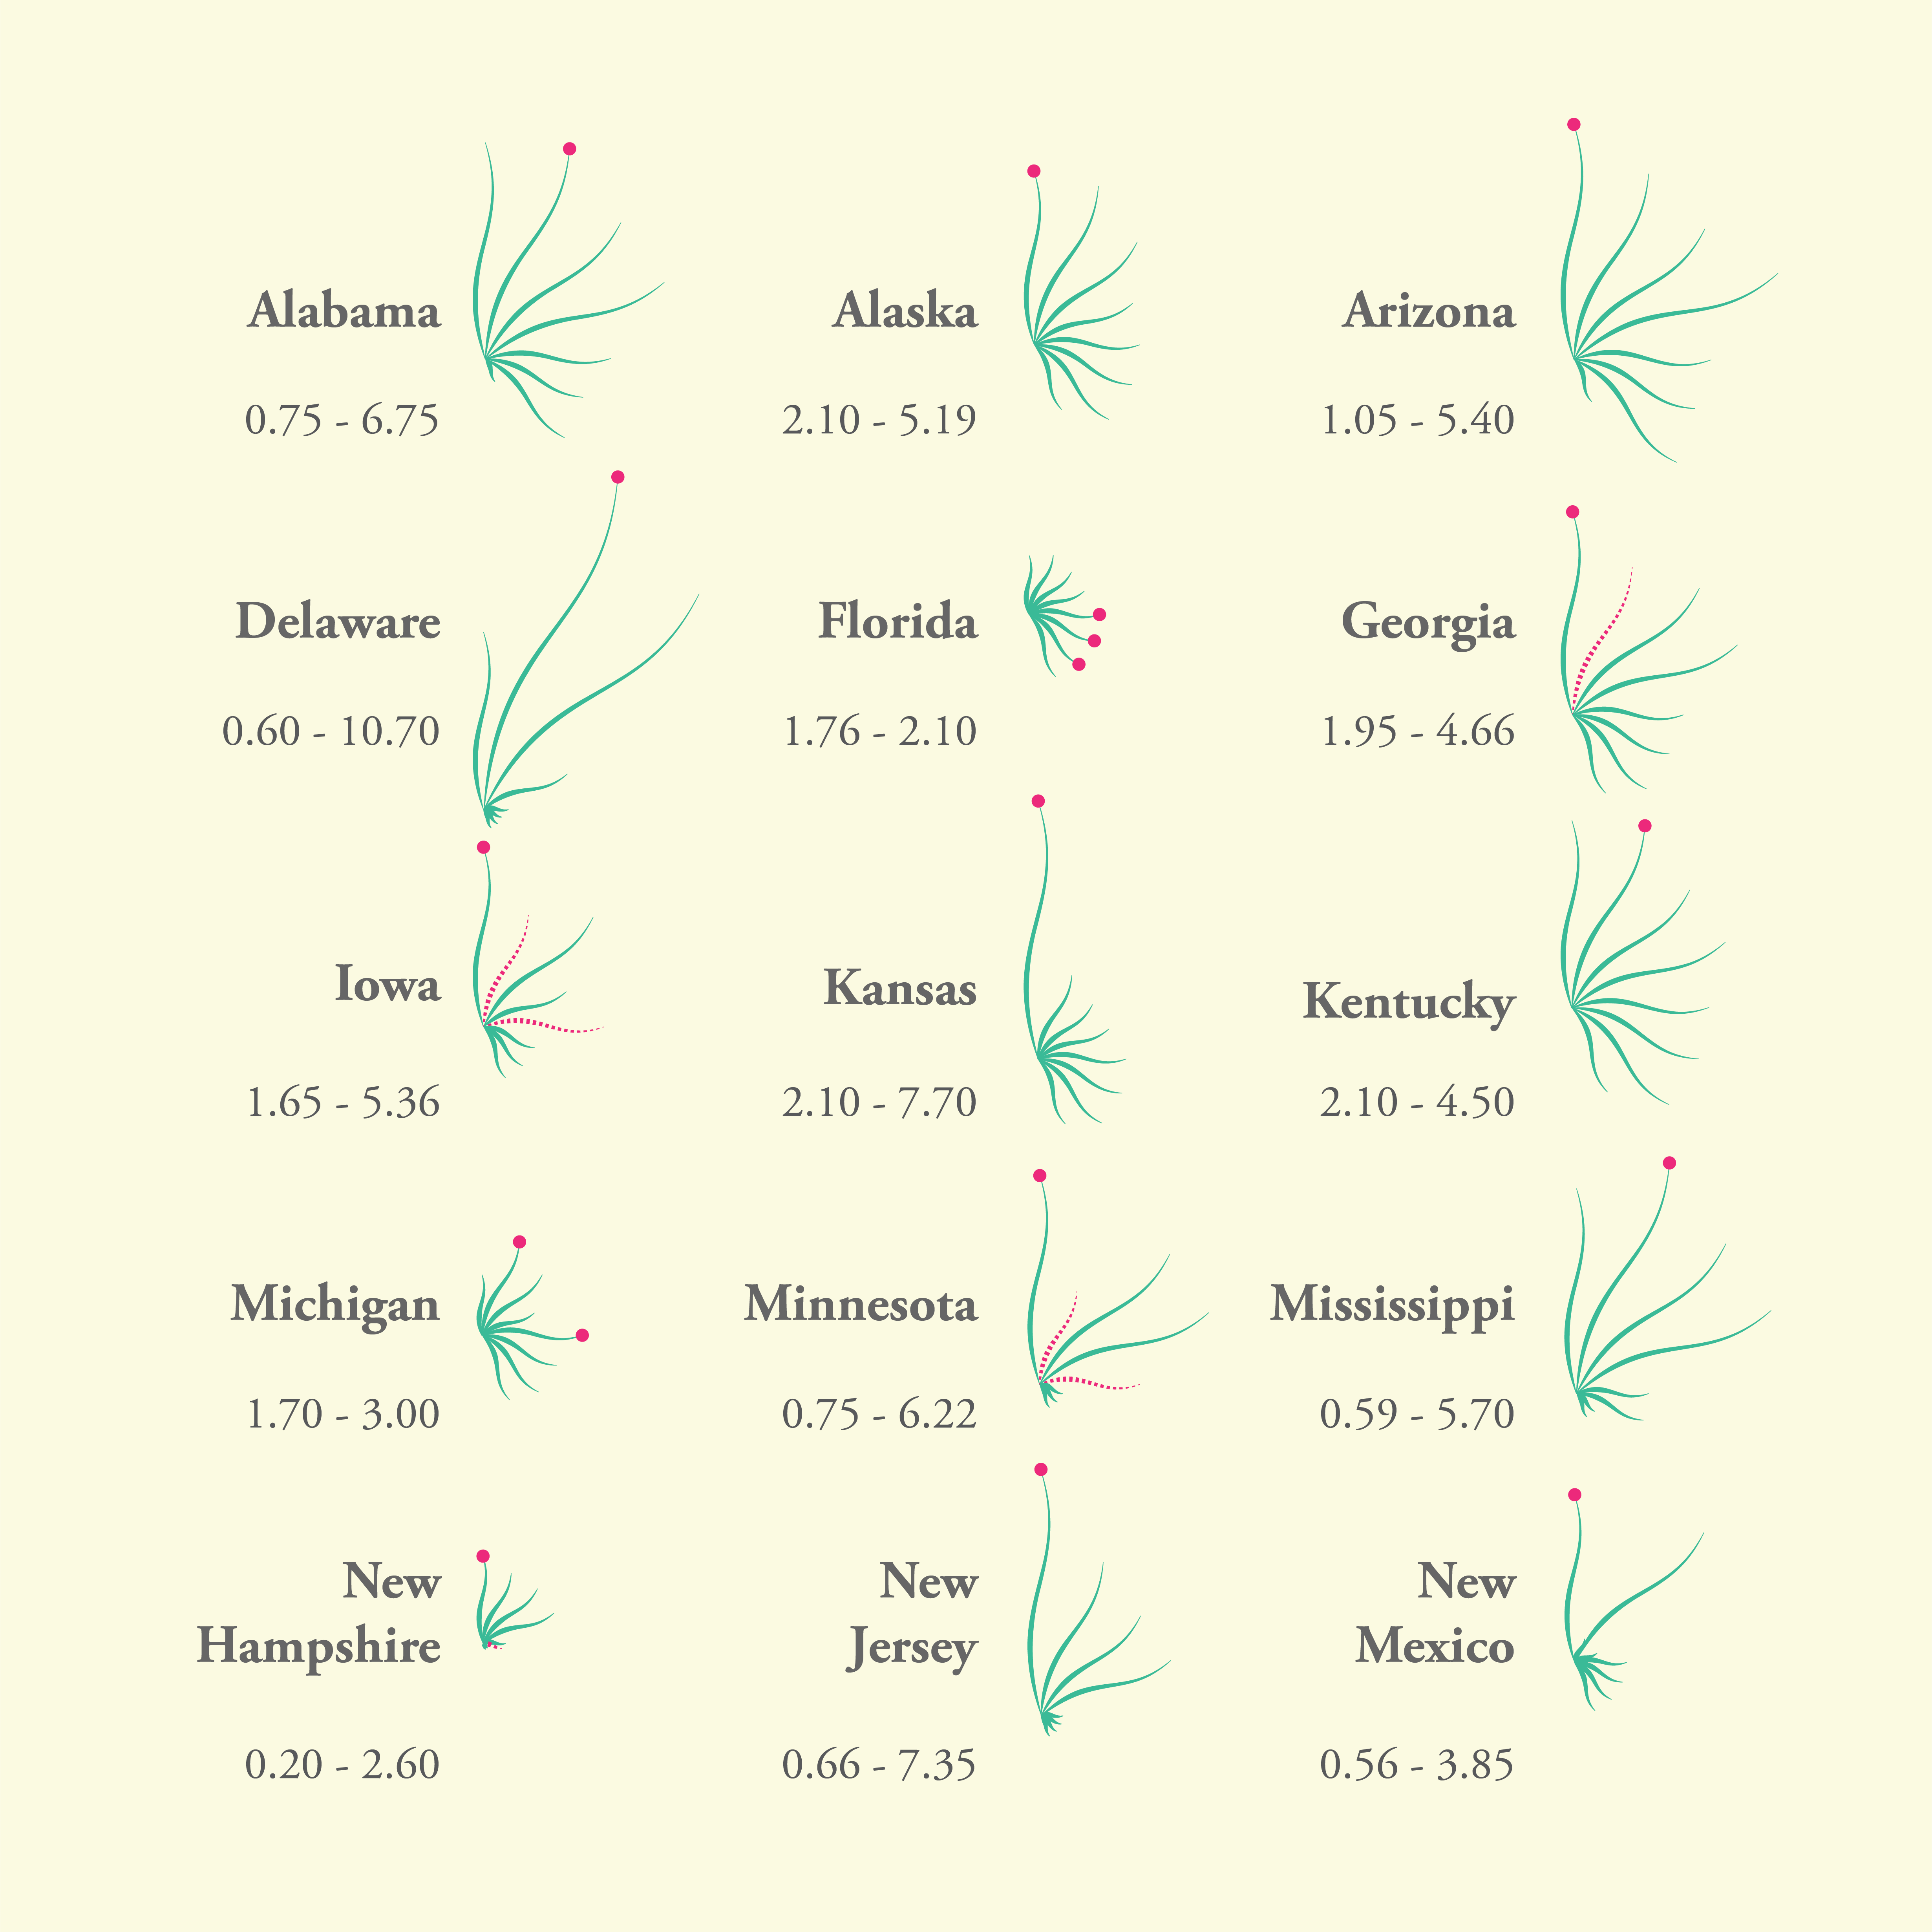
For a Scientific American story Leg and Pedal by Jesse Greenspan, I designed the graphic using data from 11,587 cities and pinpointed the TOP 15 places across the world which one study found that are just better for bikes and pedestrians. The article was published in the December 2025 print issue as part of the magazine's Advances coverage.
The dot plot shows the percentage of total kilometers traveled on foot and bicycle across cities in the 15 top countries for walking and cycling. Dots are display for the median, mean, 25th and 75th percentiles, and more outlying cities within each country.
(Click the arrows to see print, desktop and mobile versions)
A graphic for Scientific American on China's new proposed two-headed wind turbine.
The World's Largest Wind Turbine Will Smash Previous Records
November 2025 • Scientific American
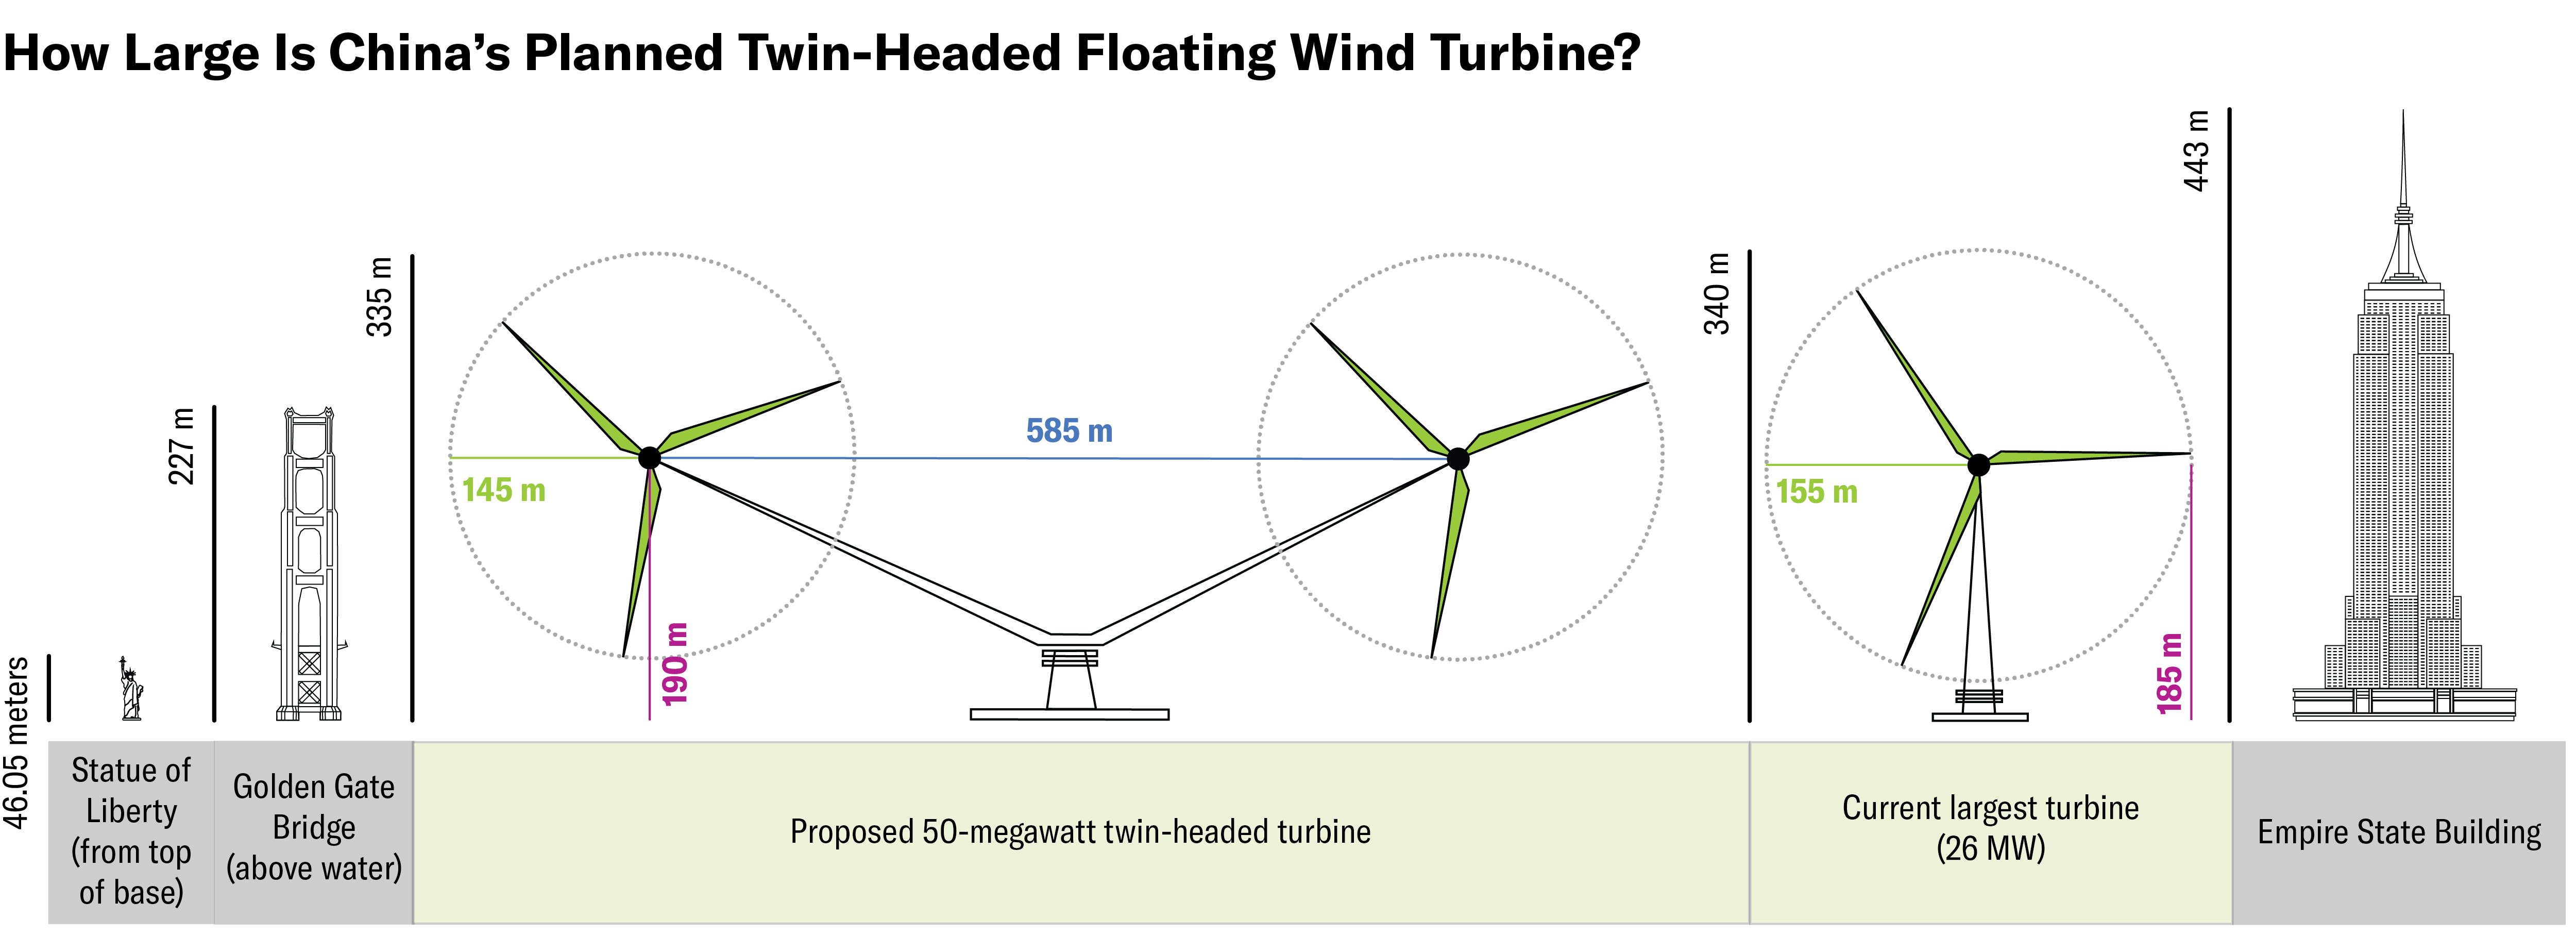
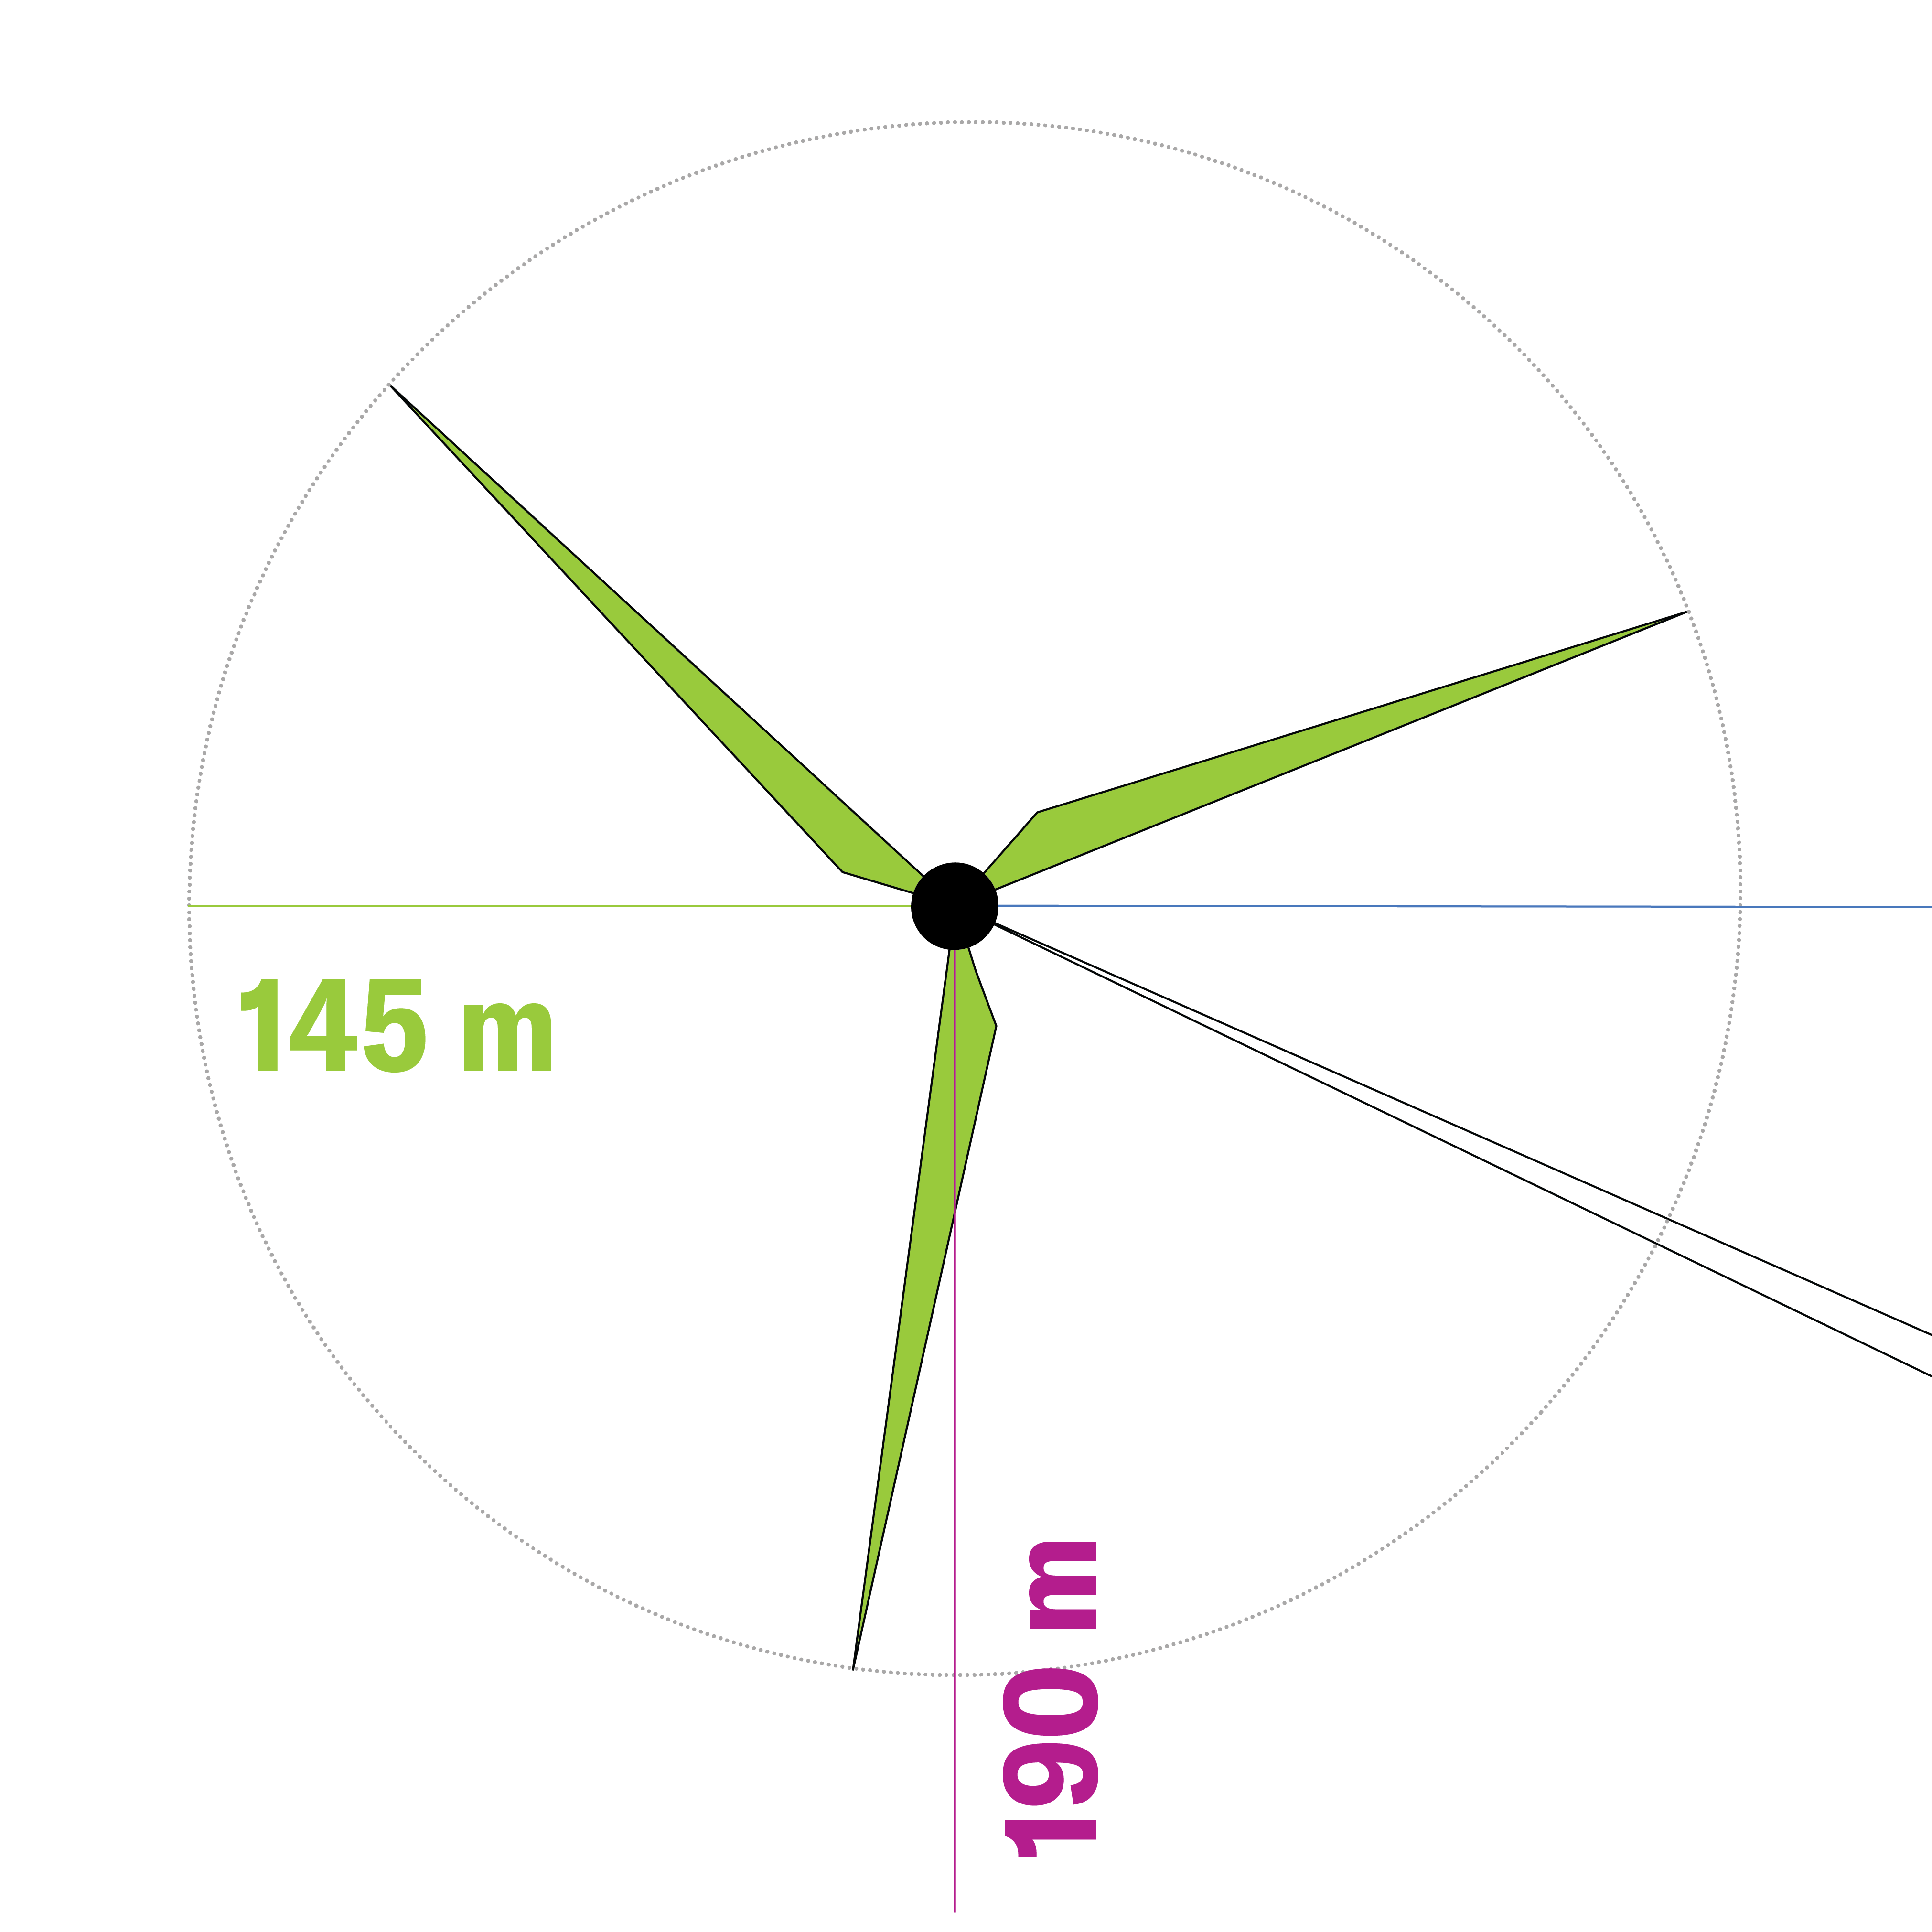
For a Scientific American story The World's Largest Wind Turbine Will Smash Previous Records by Xiaoying You, I created a comparison illustration to show how large China's proposed supersized two-rotor floating wind turbine would be–the design will soon break the current record held by Dongfang Electric’s 26 MW turbine, with a tower as tall as a 63-story skyscraper.
This was an absolute fun one to work on as I put its scale in perspective by comparing it with familiar landmarks. Each of its blades is 145 meters long, and the full structure would stand 335 meters tall—nearly three times the Statue of Liberty (46.05 m), taller than the Golden Gate Bridge (227 m), and just shy of both the world's largest turbine (340 m) and the Empire State Building with its antenna (443 m).
(Click the arrows to see both desktop and mobile versions)
People Are More Likely to Cheat When They Use AI
September 2025 • Scientific American
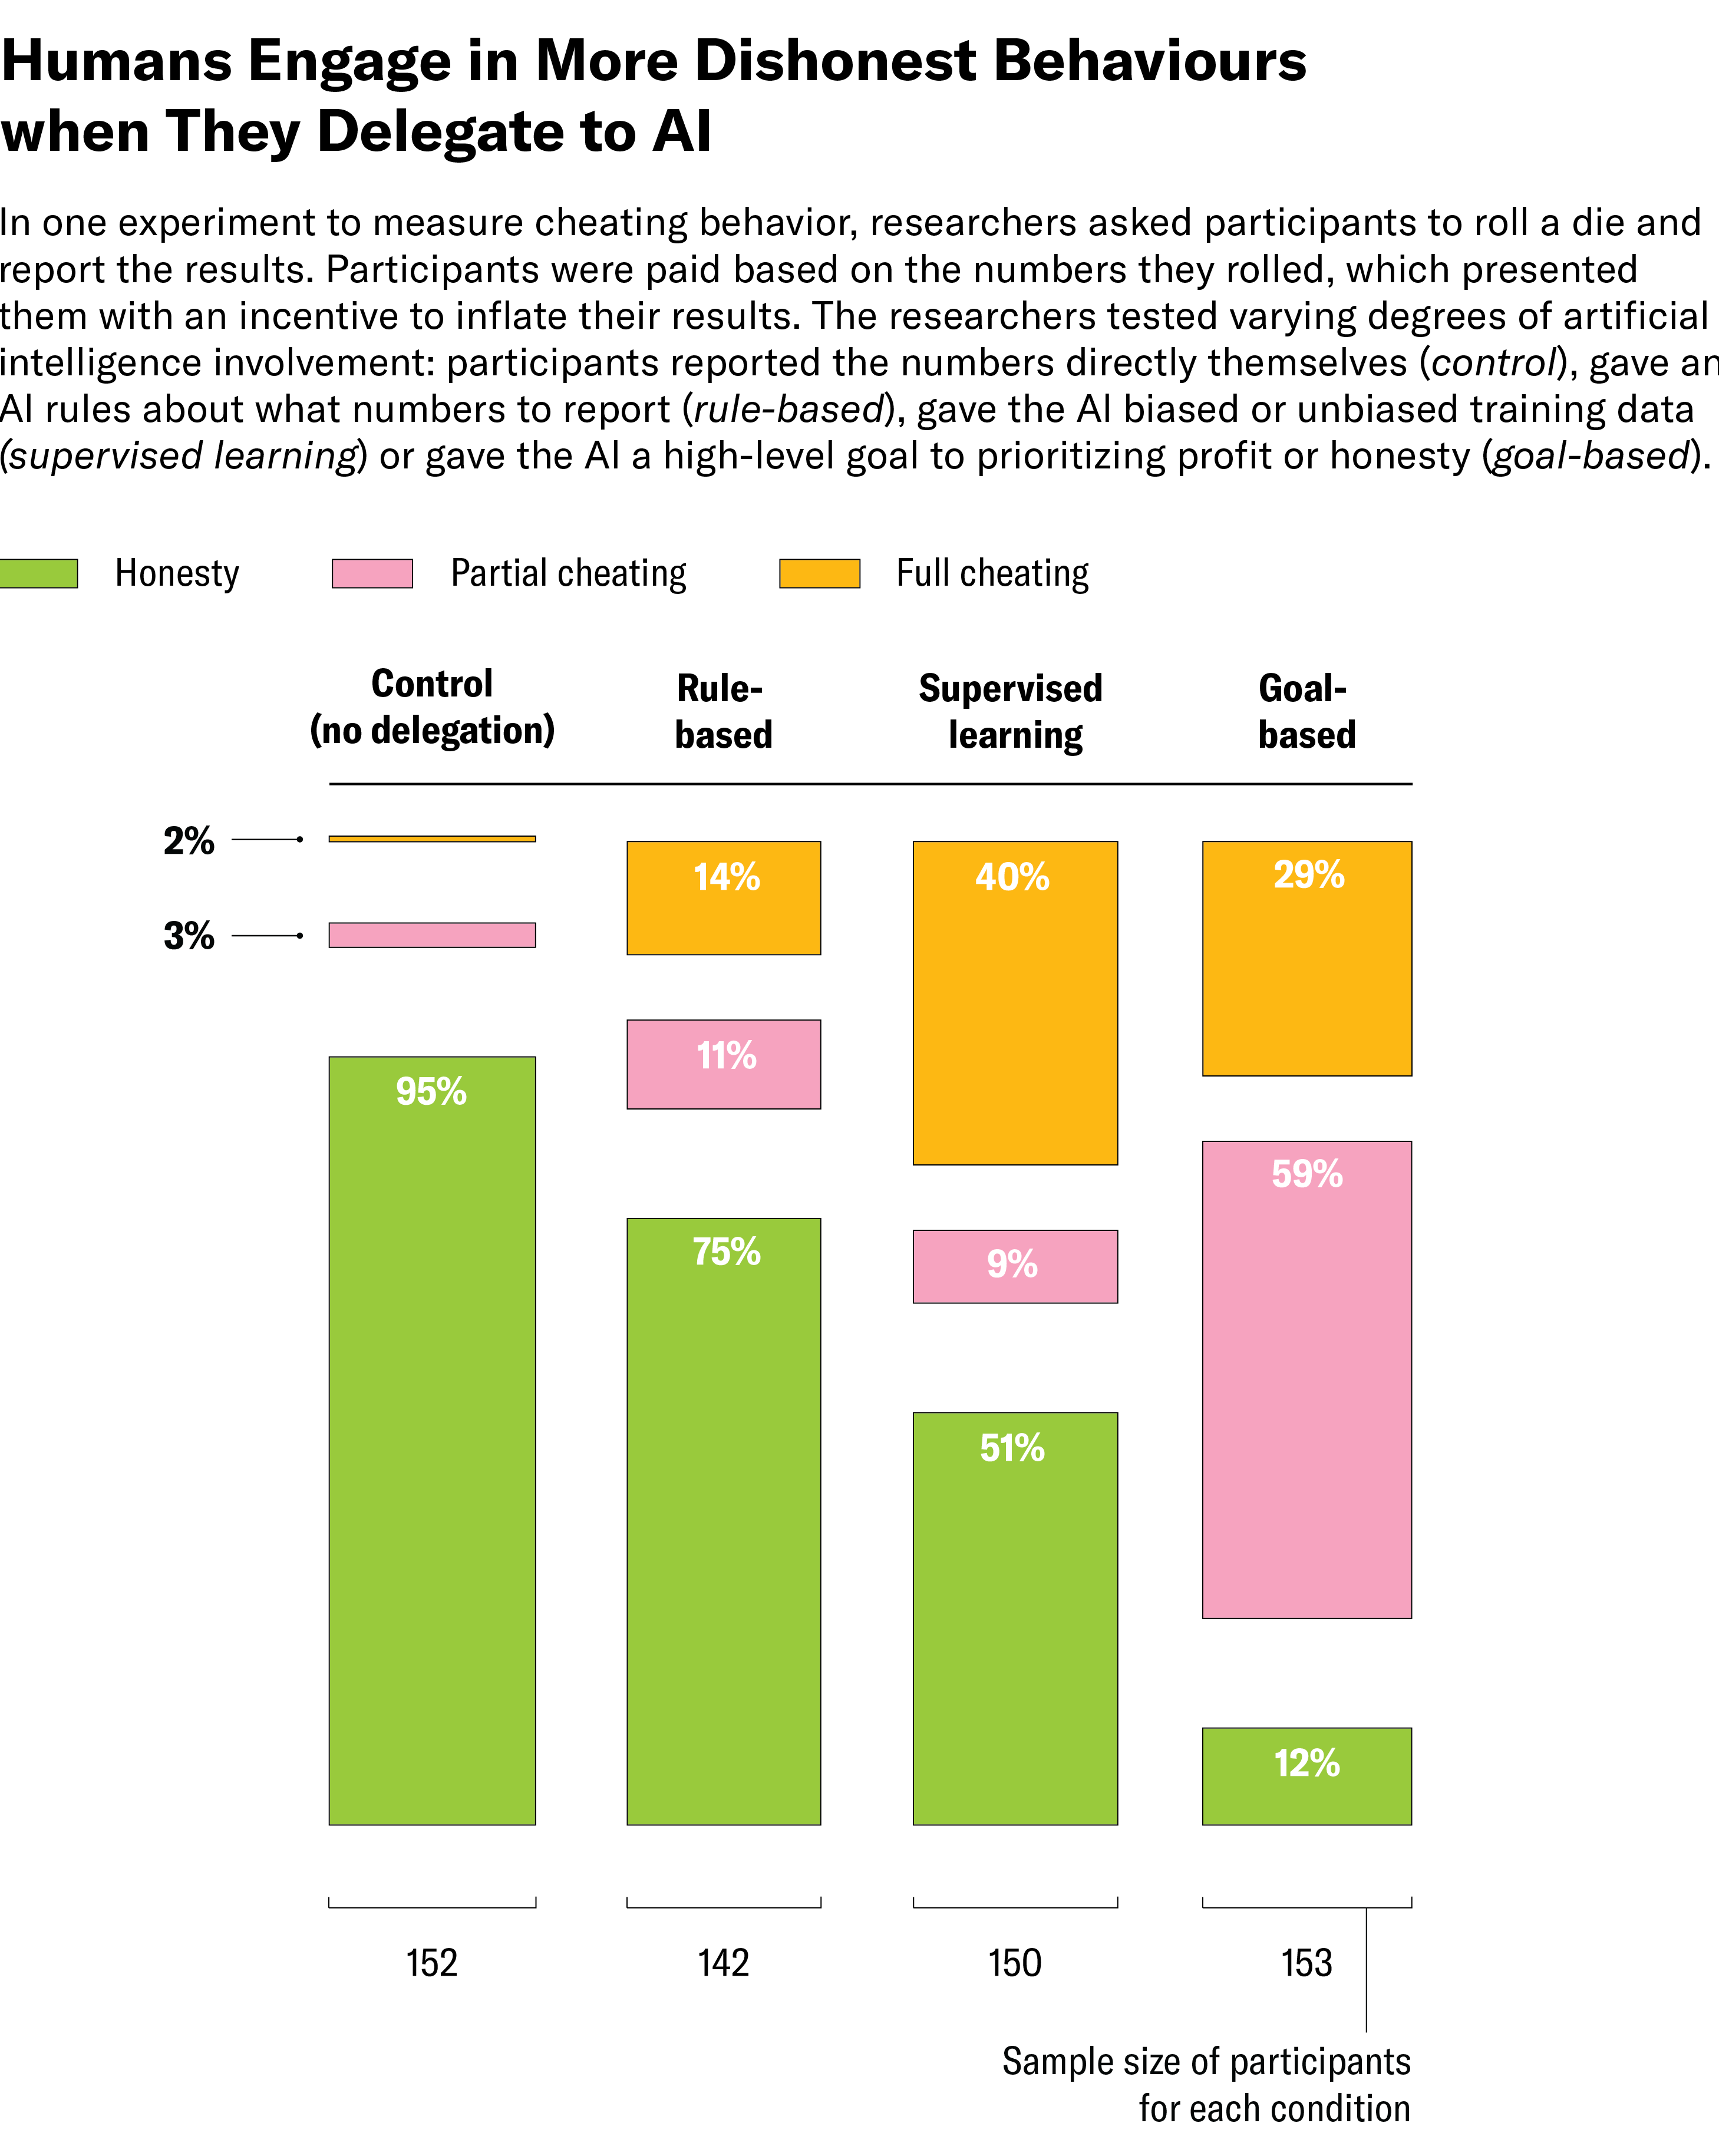
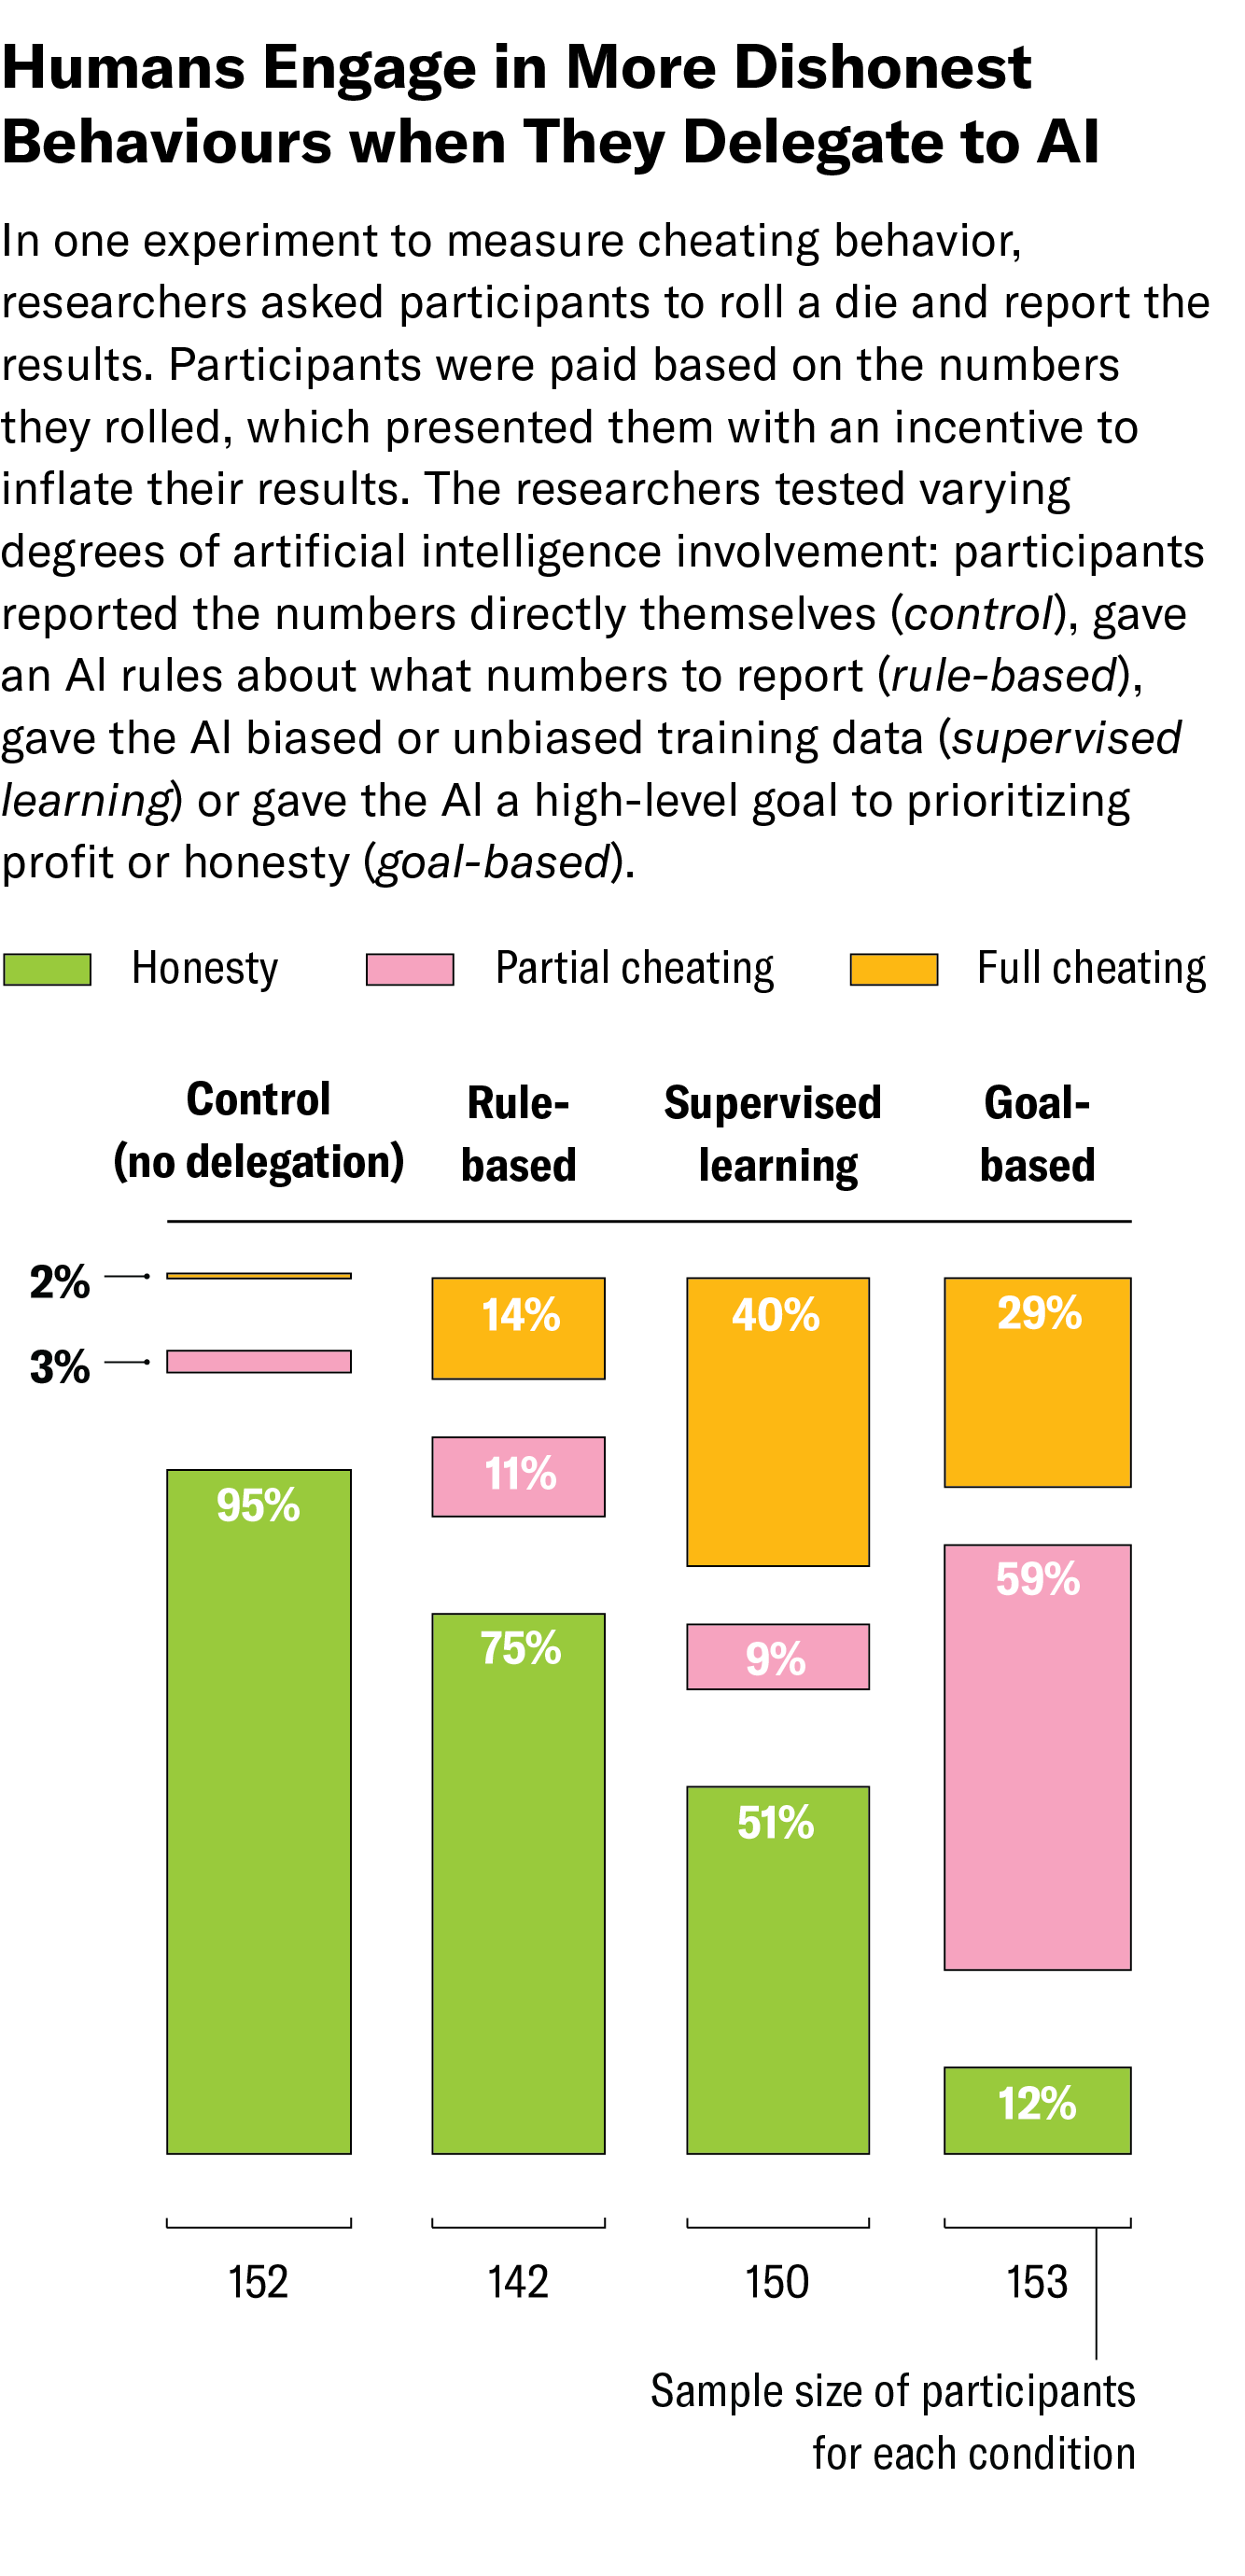
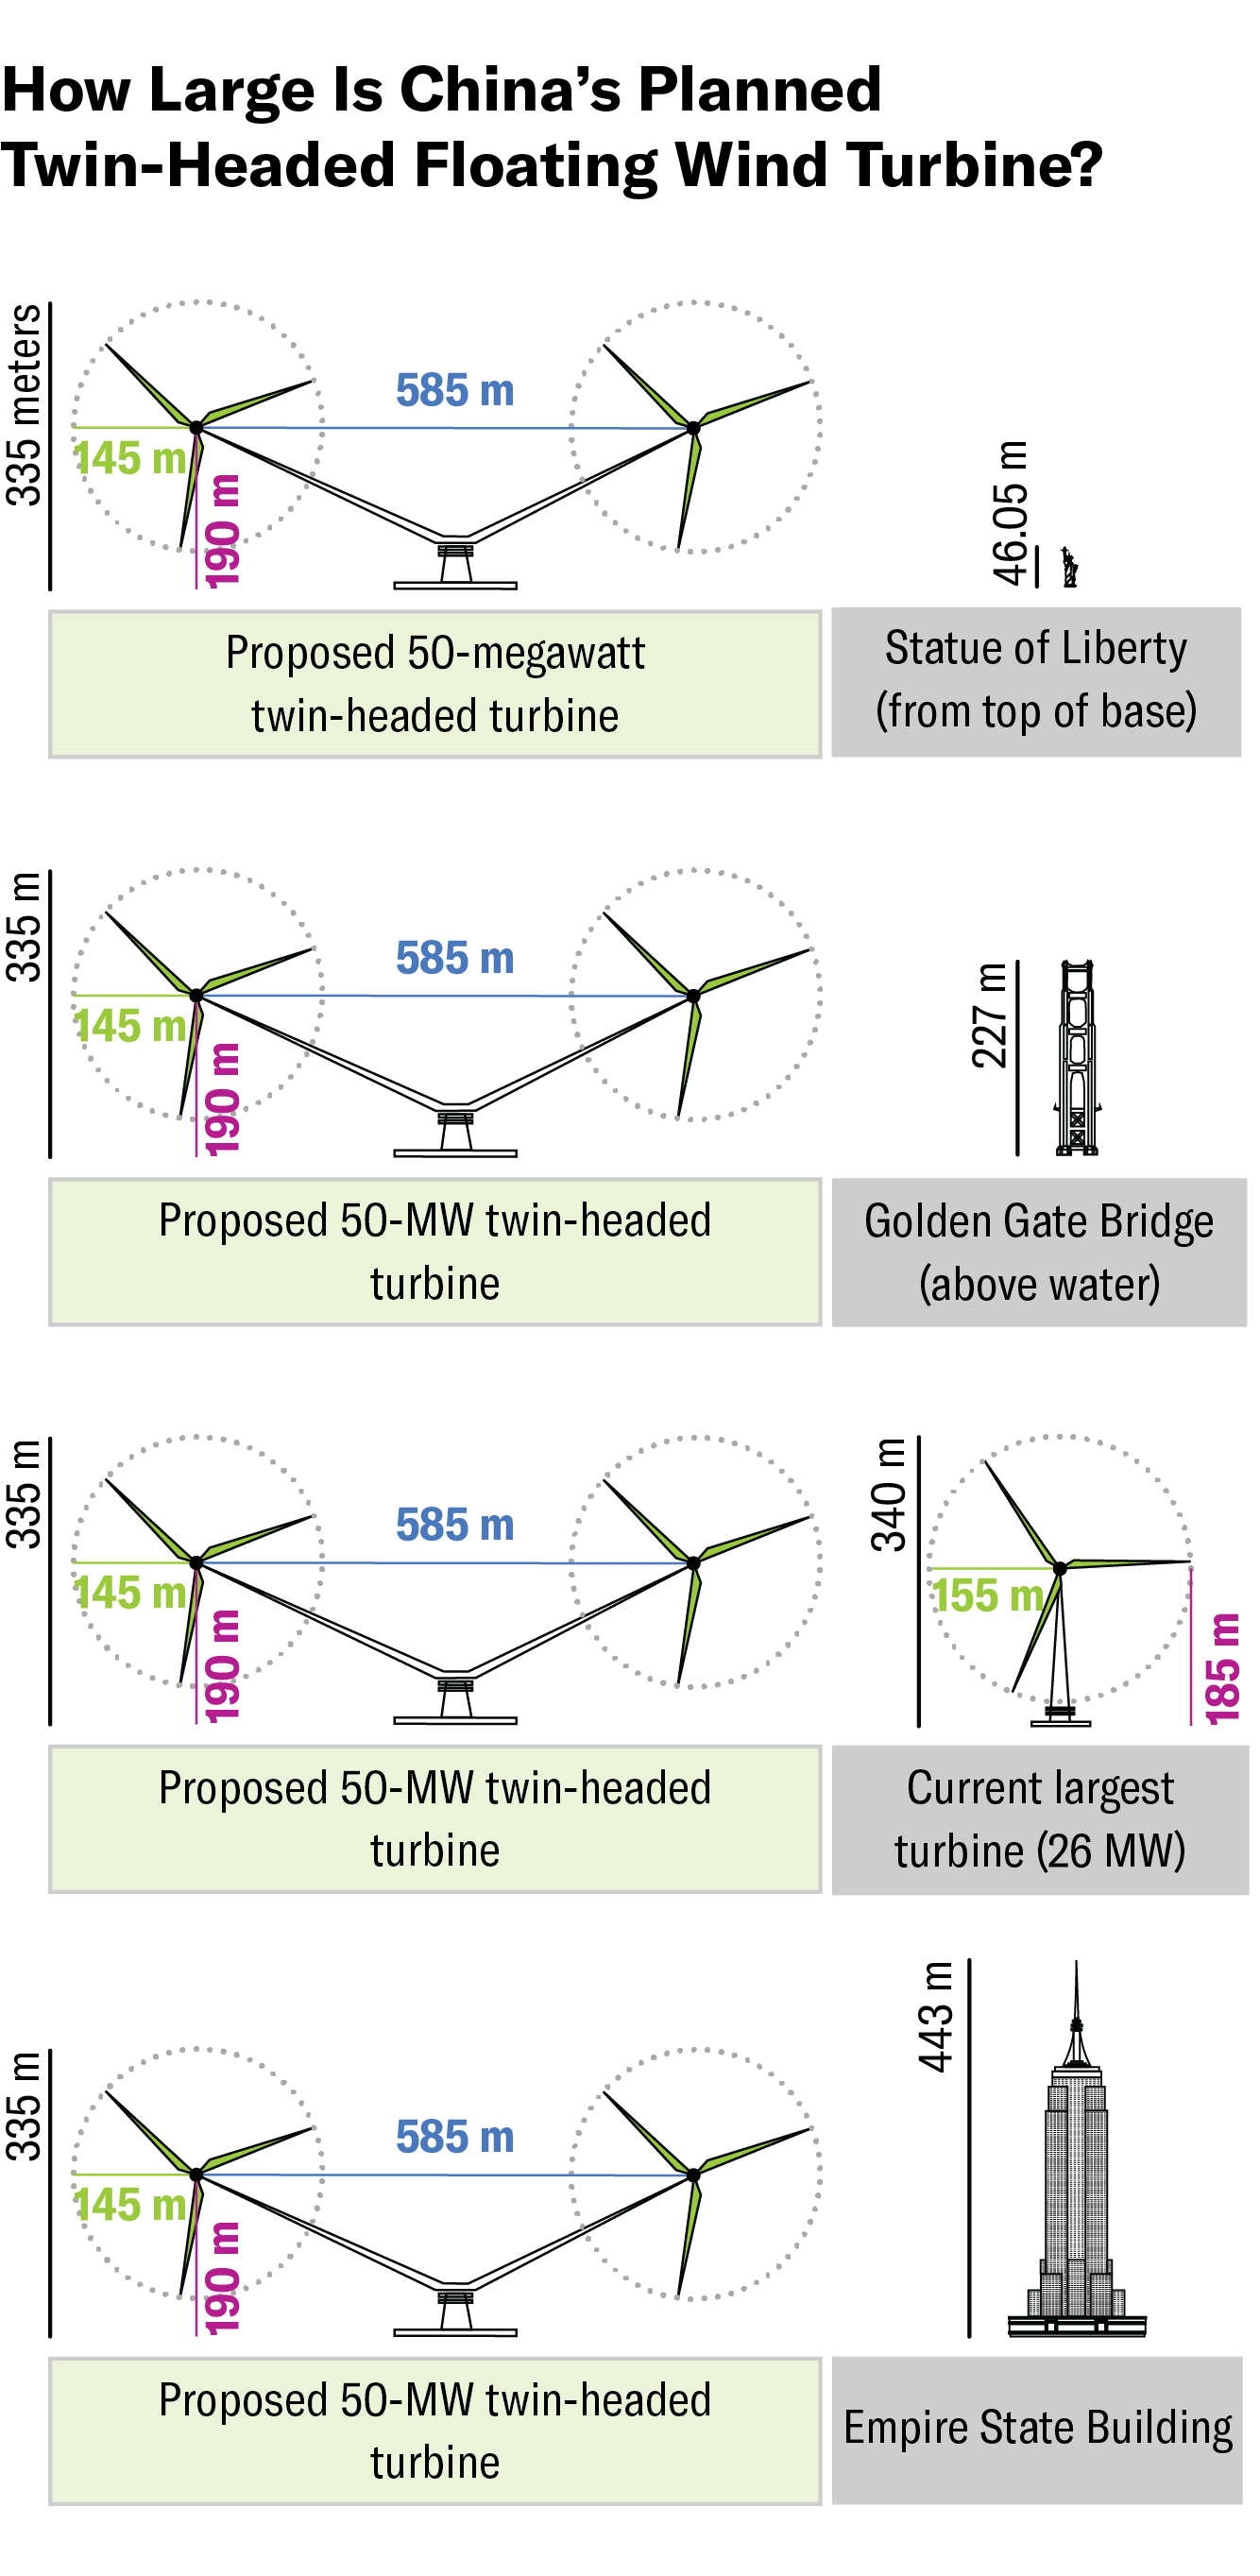
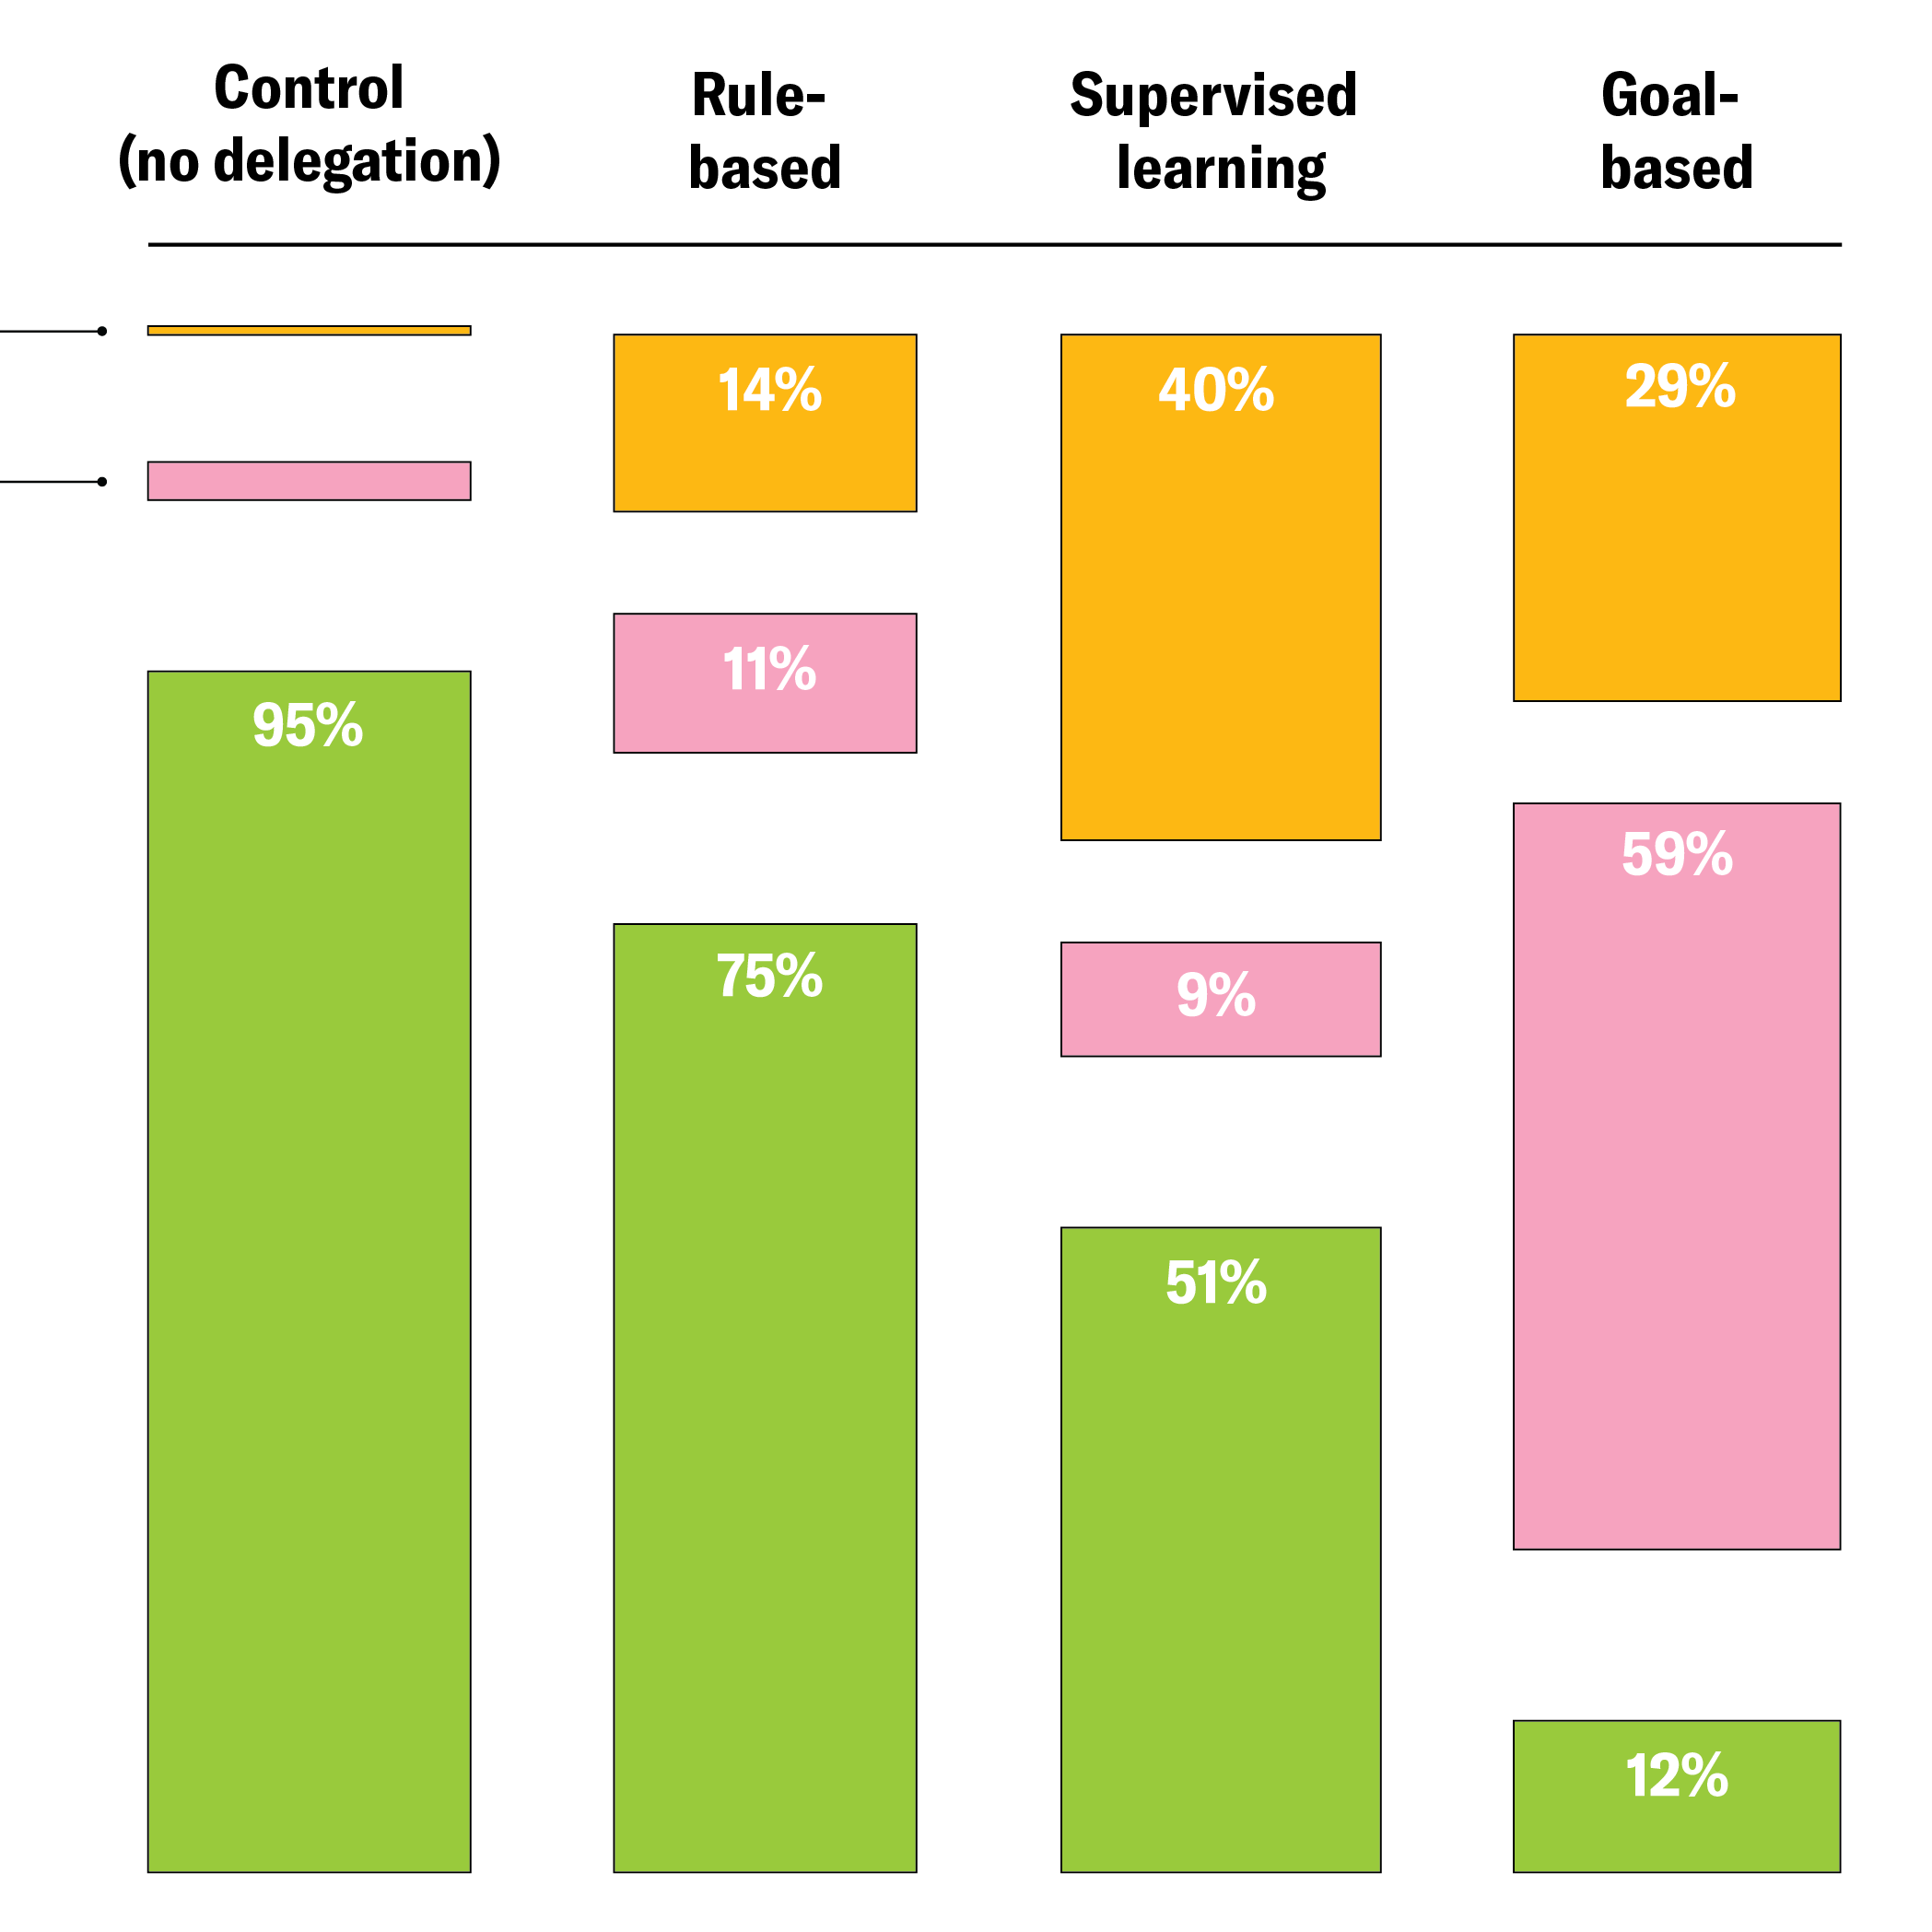
For a Scientific American story People Are More Likely to Cheat When They Use AI by Rachel Nuwer, I produced a marimekko chart that shows how participants were more inclined to act dishonestly for profit under AI-involved conditions, often by reporting a die-roll result that was higher than the observed roll.
The study compared different scenarios, including a supervised learning condition where the AI was trained on biased or unbiased data, and a goal-based condition where the AI was given a high-level goal to prioritize either profit or honesty.
(Click the arrows to see both desktop and mobile versions)
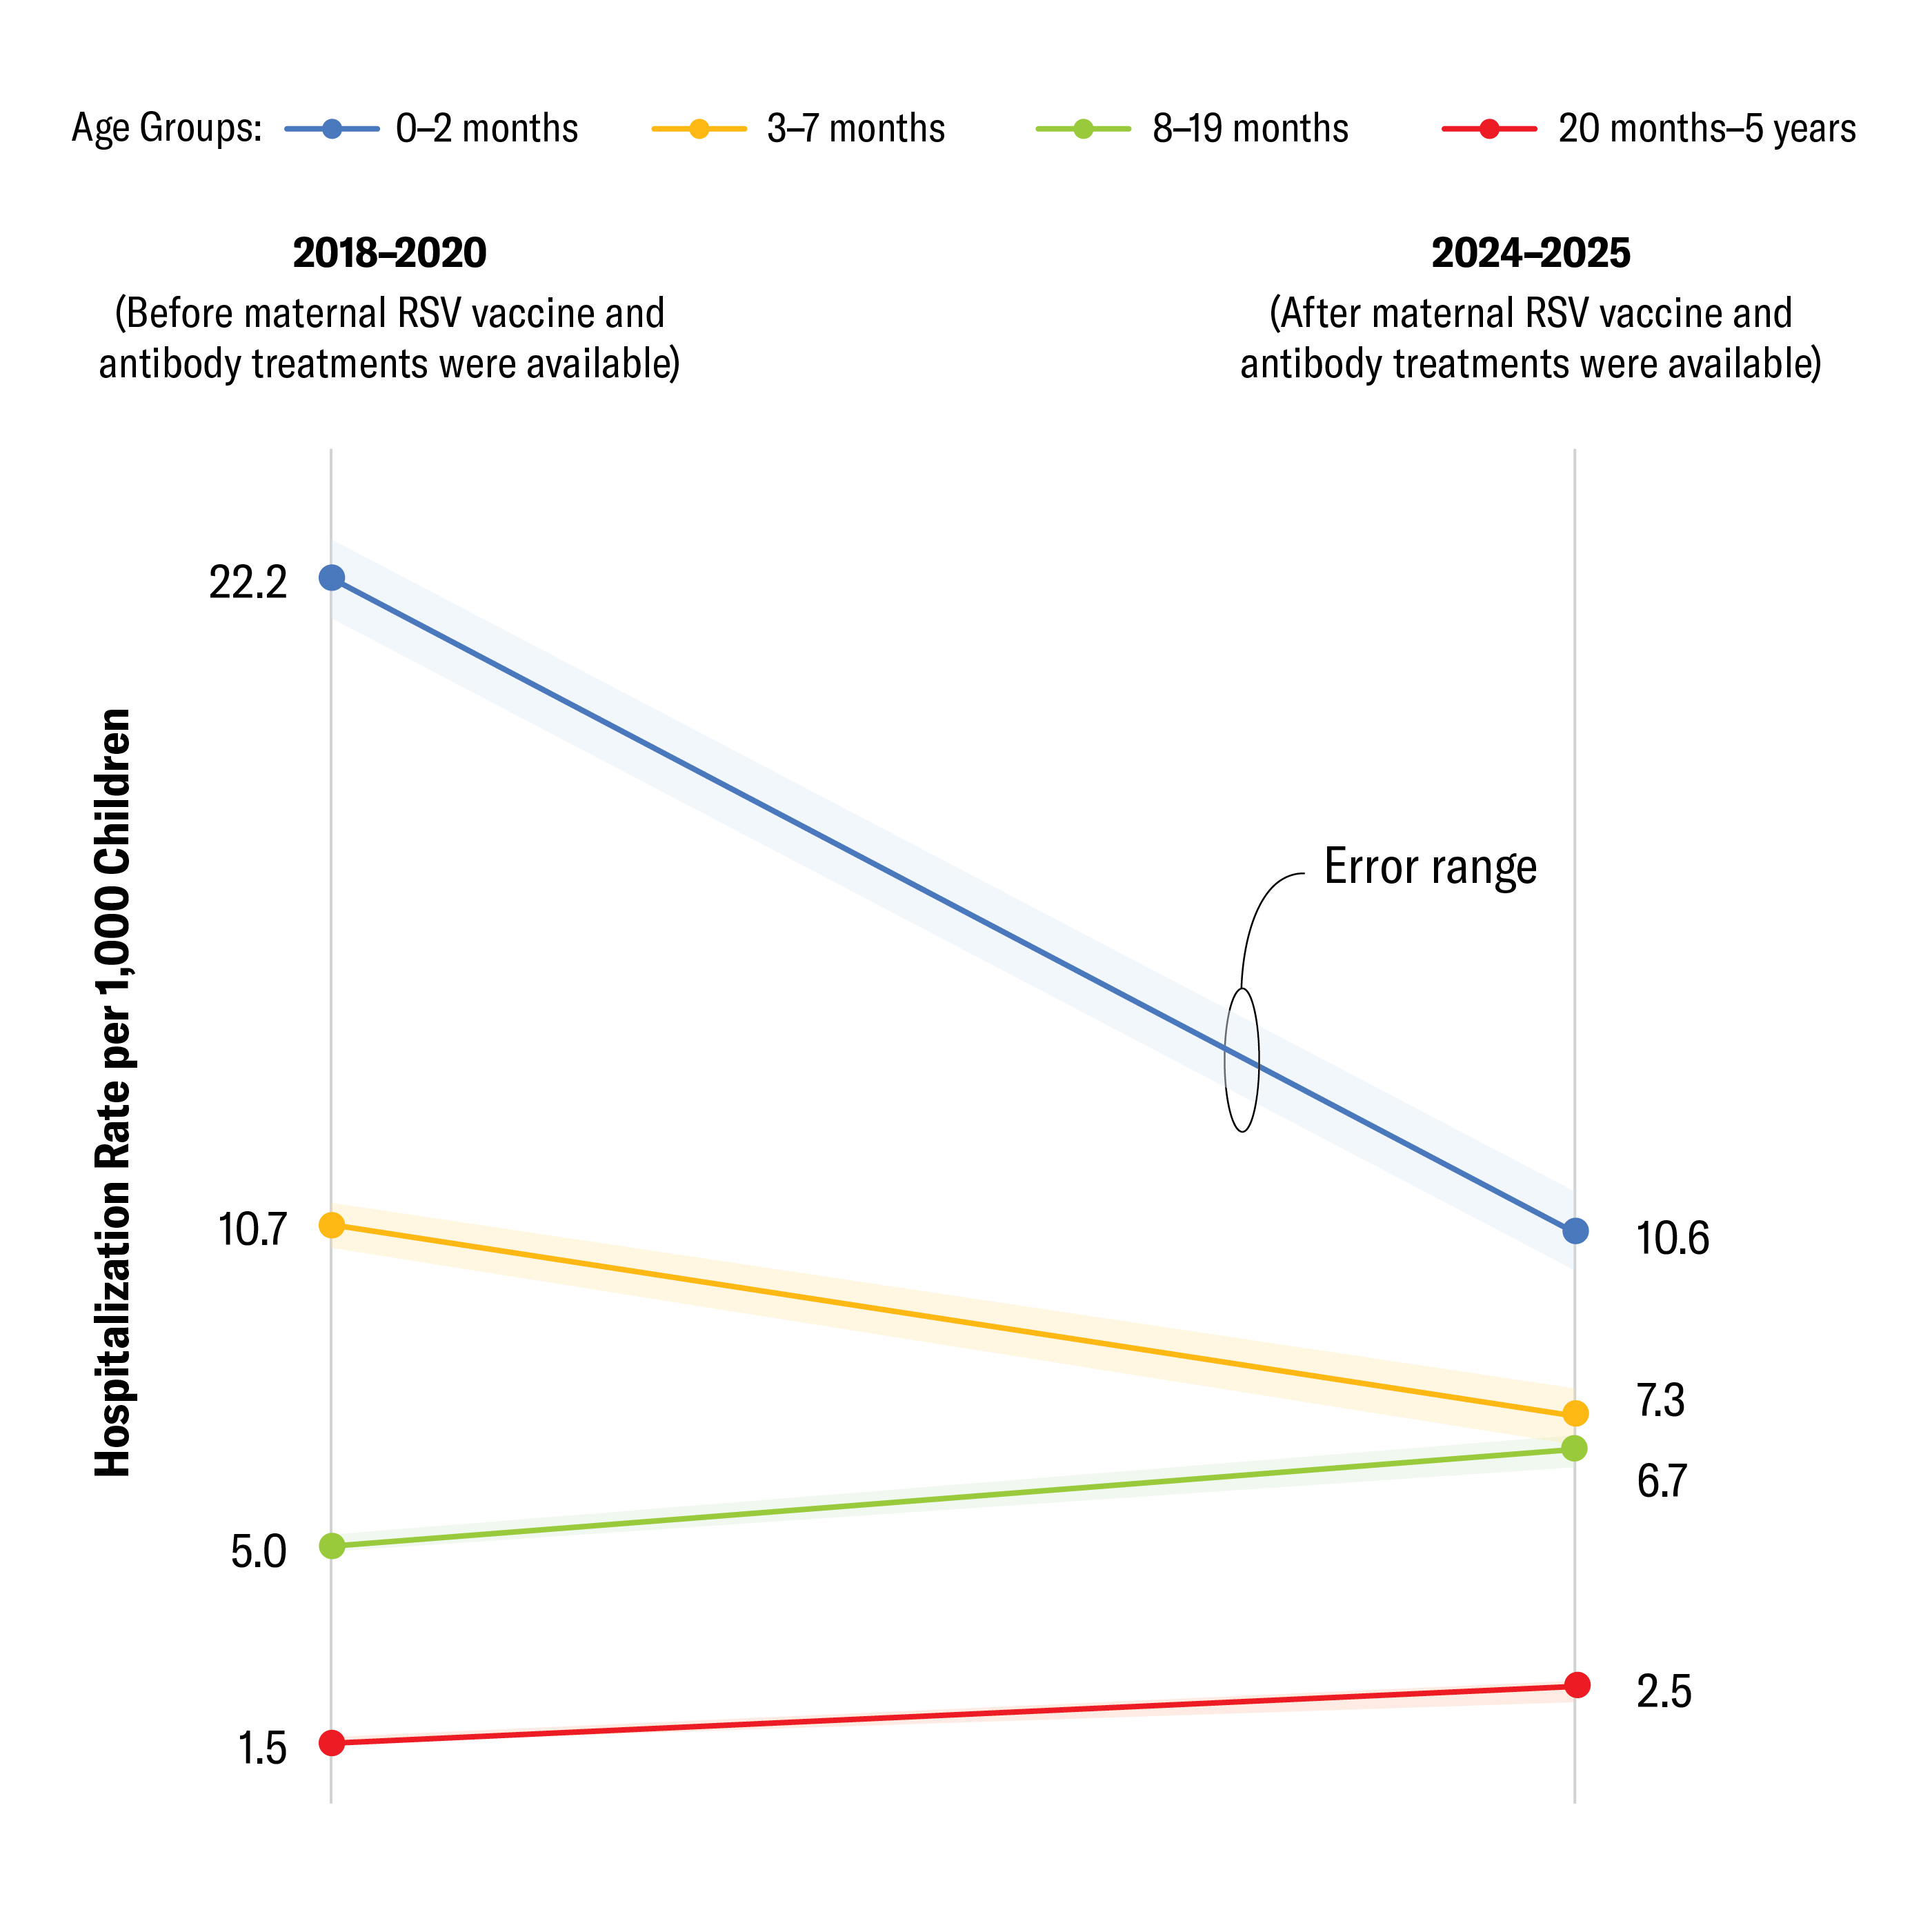
Advances Drive Drop in RSV Hospitalizations
September 2025 • Scientific American
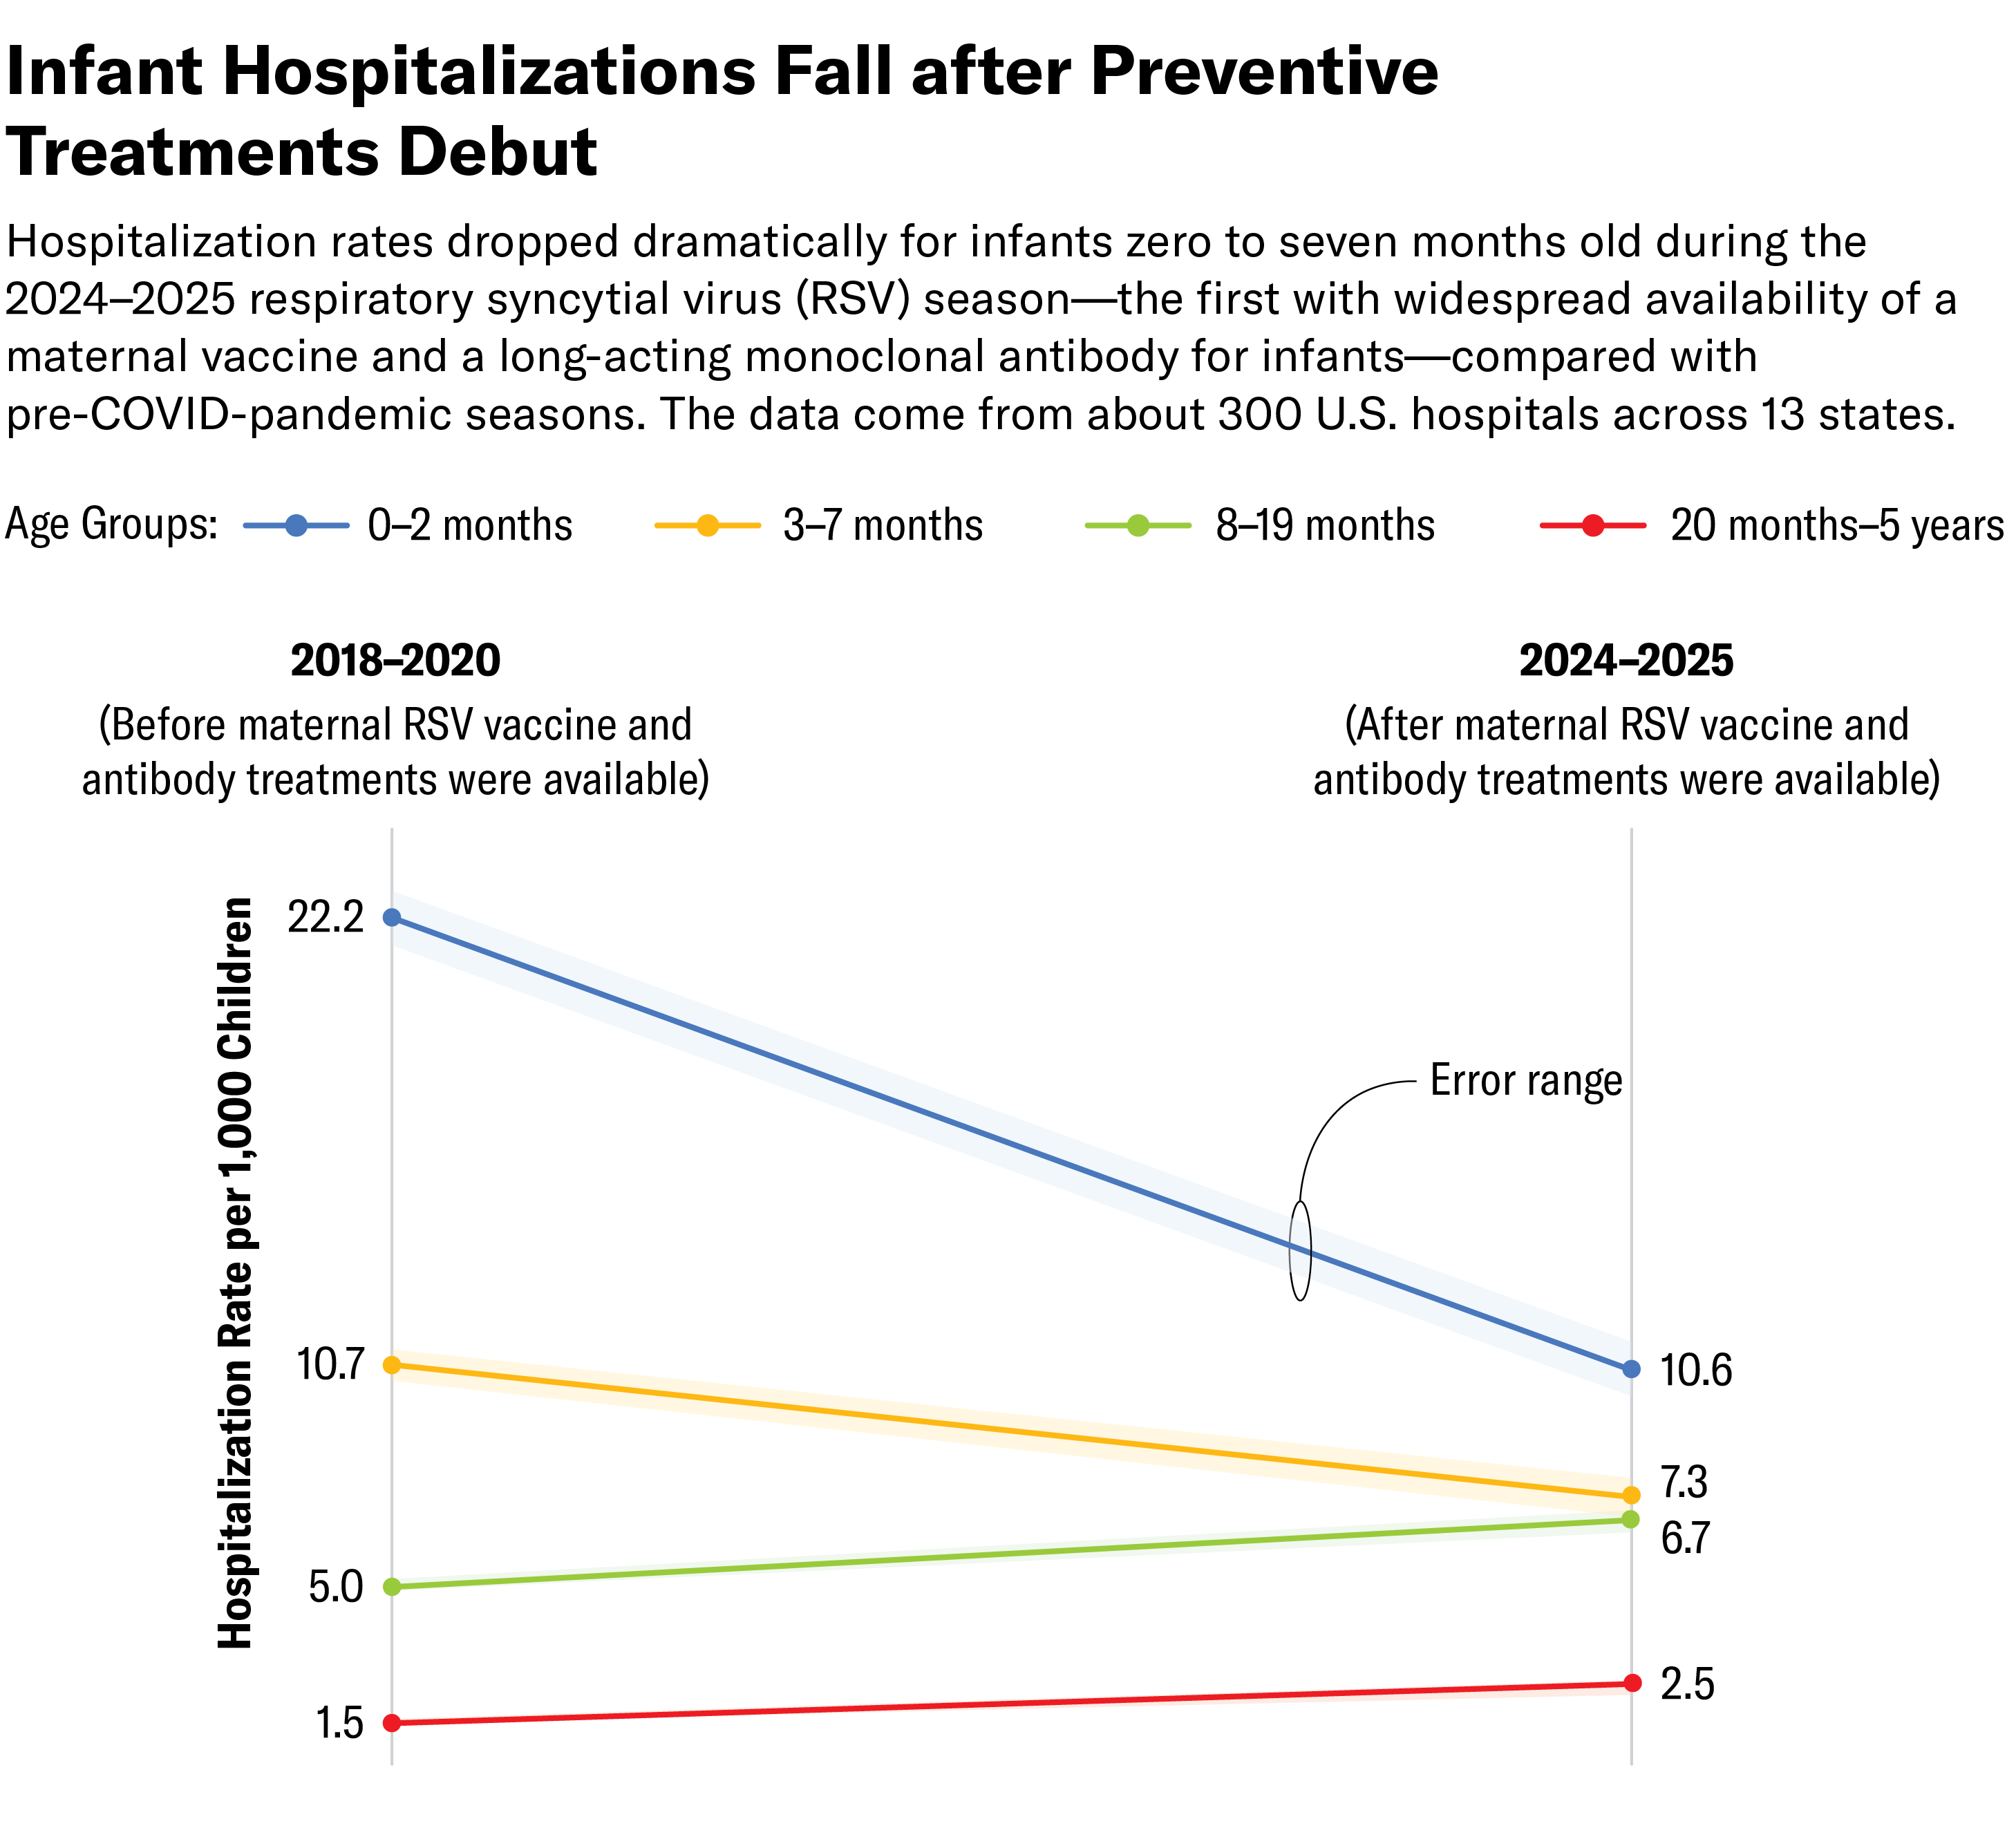
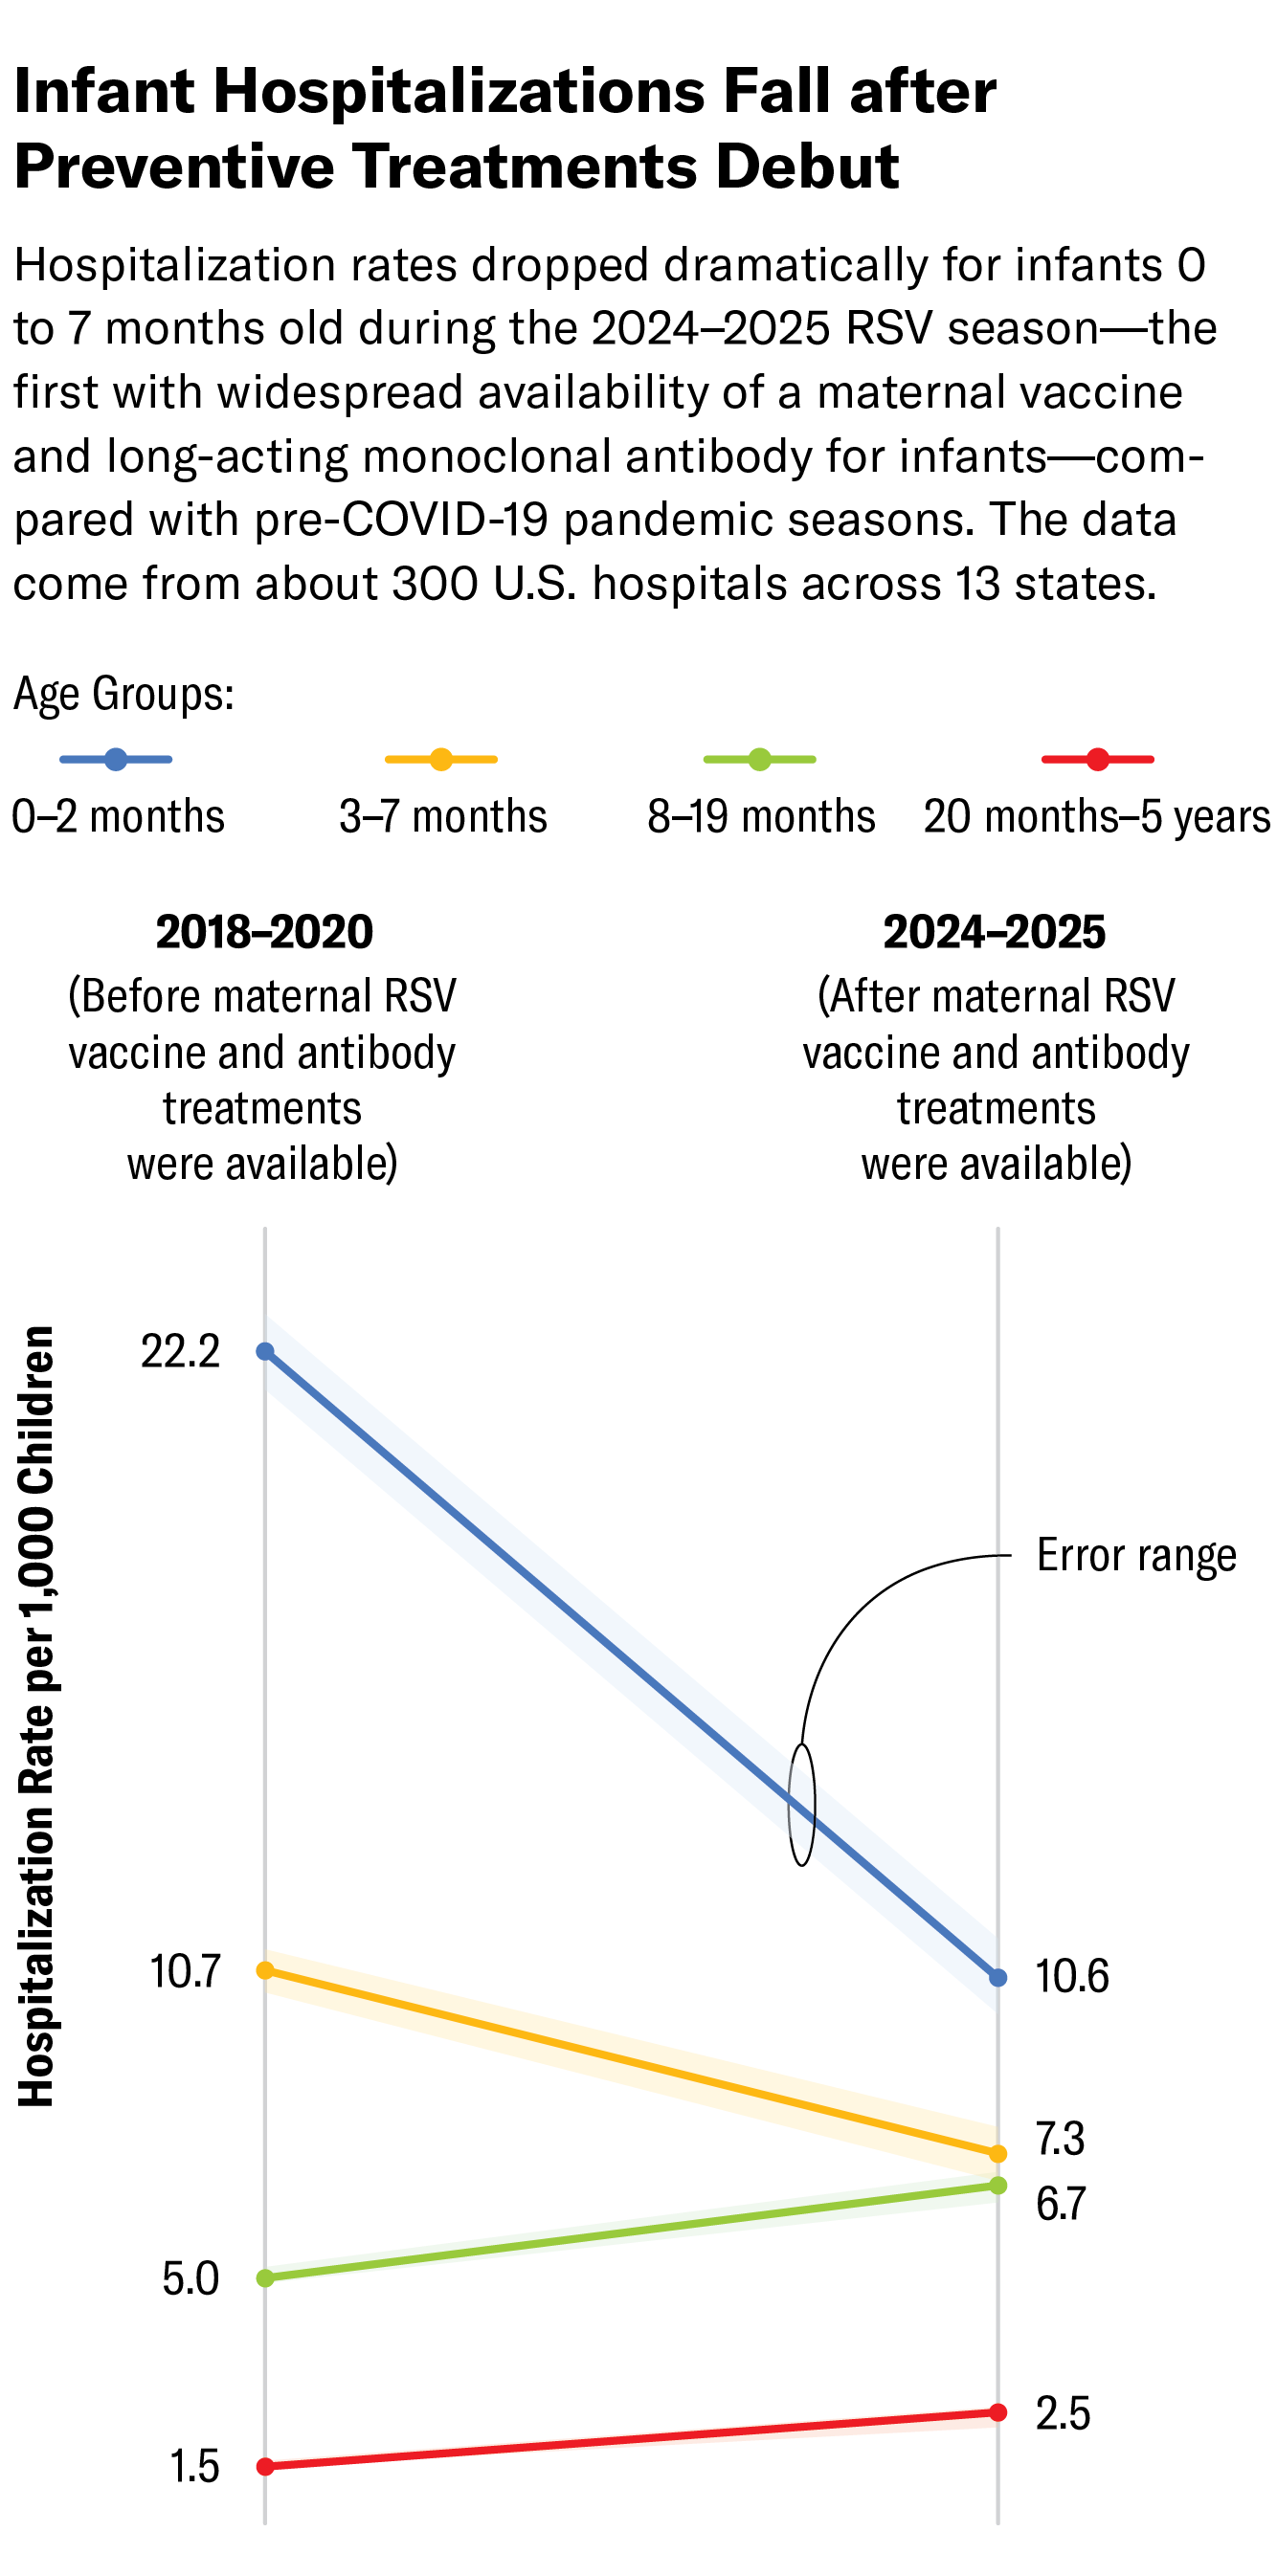
For a Scientific American story Advances Drive 'Stunning' Drop in Infant RSV Hospitalizations by Mark Kreidler, as part of the special series “Innovations In: RSV,” I made a graphic that pinpoints the change in infants hospitalization rates during the 2024-2025 RSV season compared with pre-pandemic years, after the new RSV preventatives became available, according to recent CDC analysis published in May 2025.
The chart shows hospitalization rates declined significantly for infants aged zero to seven months during the 2024-2025 RSV season, when maternal RSV vaccine and antibody treatments were first available, compared with the pre-COVID RSV seasons from 2018 to 2020.
(Click the arrows to see both desktop and mobile versions)
Who Attends the Hottest School?
September 2025 • Scientific American
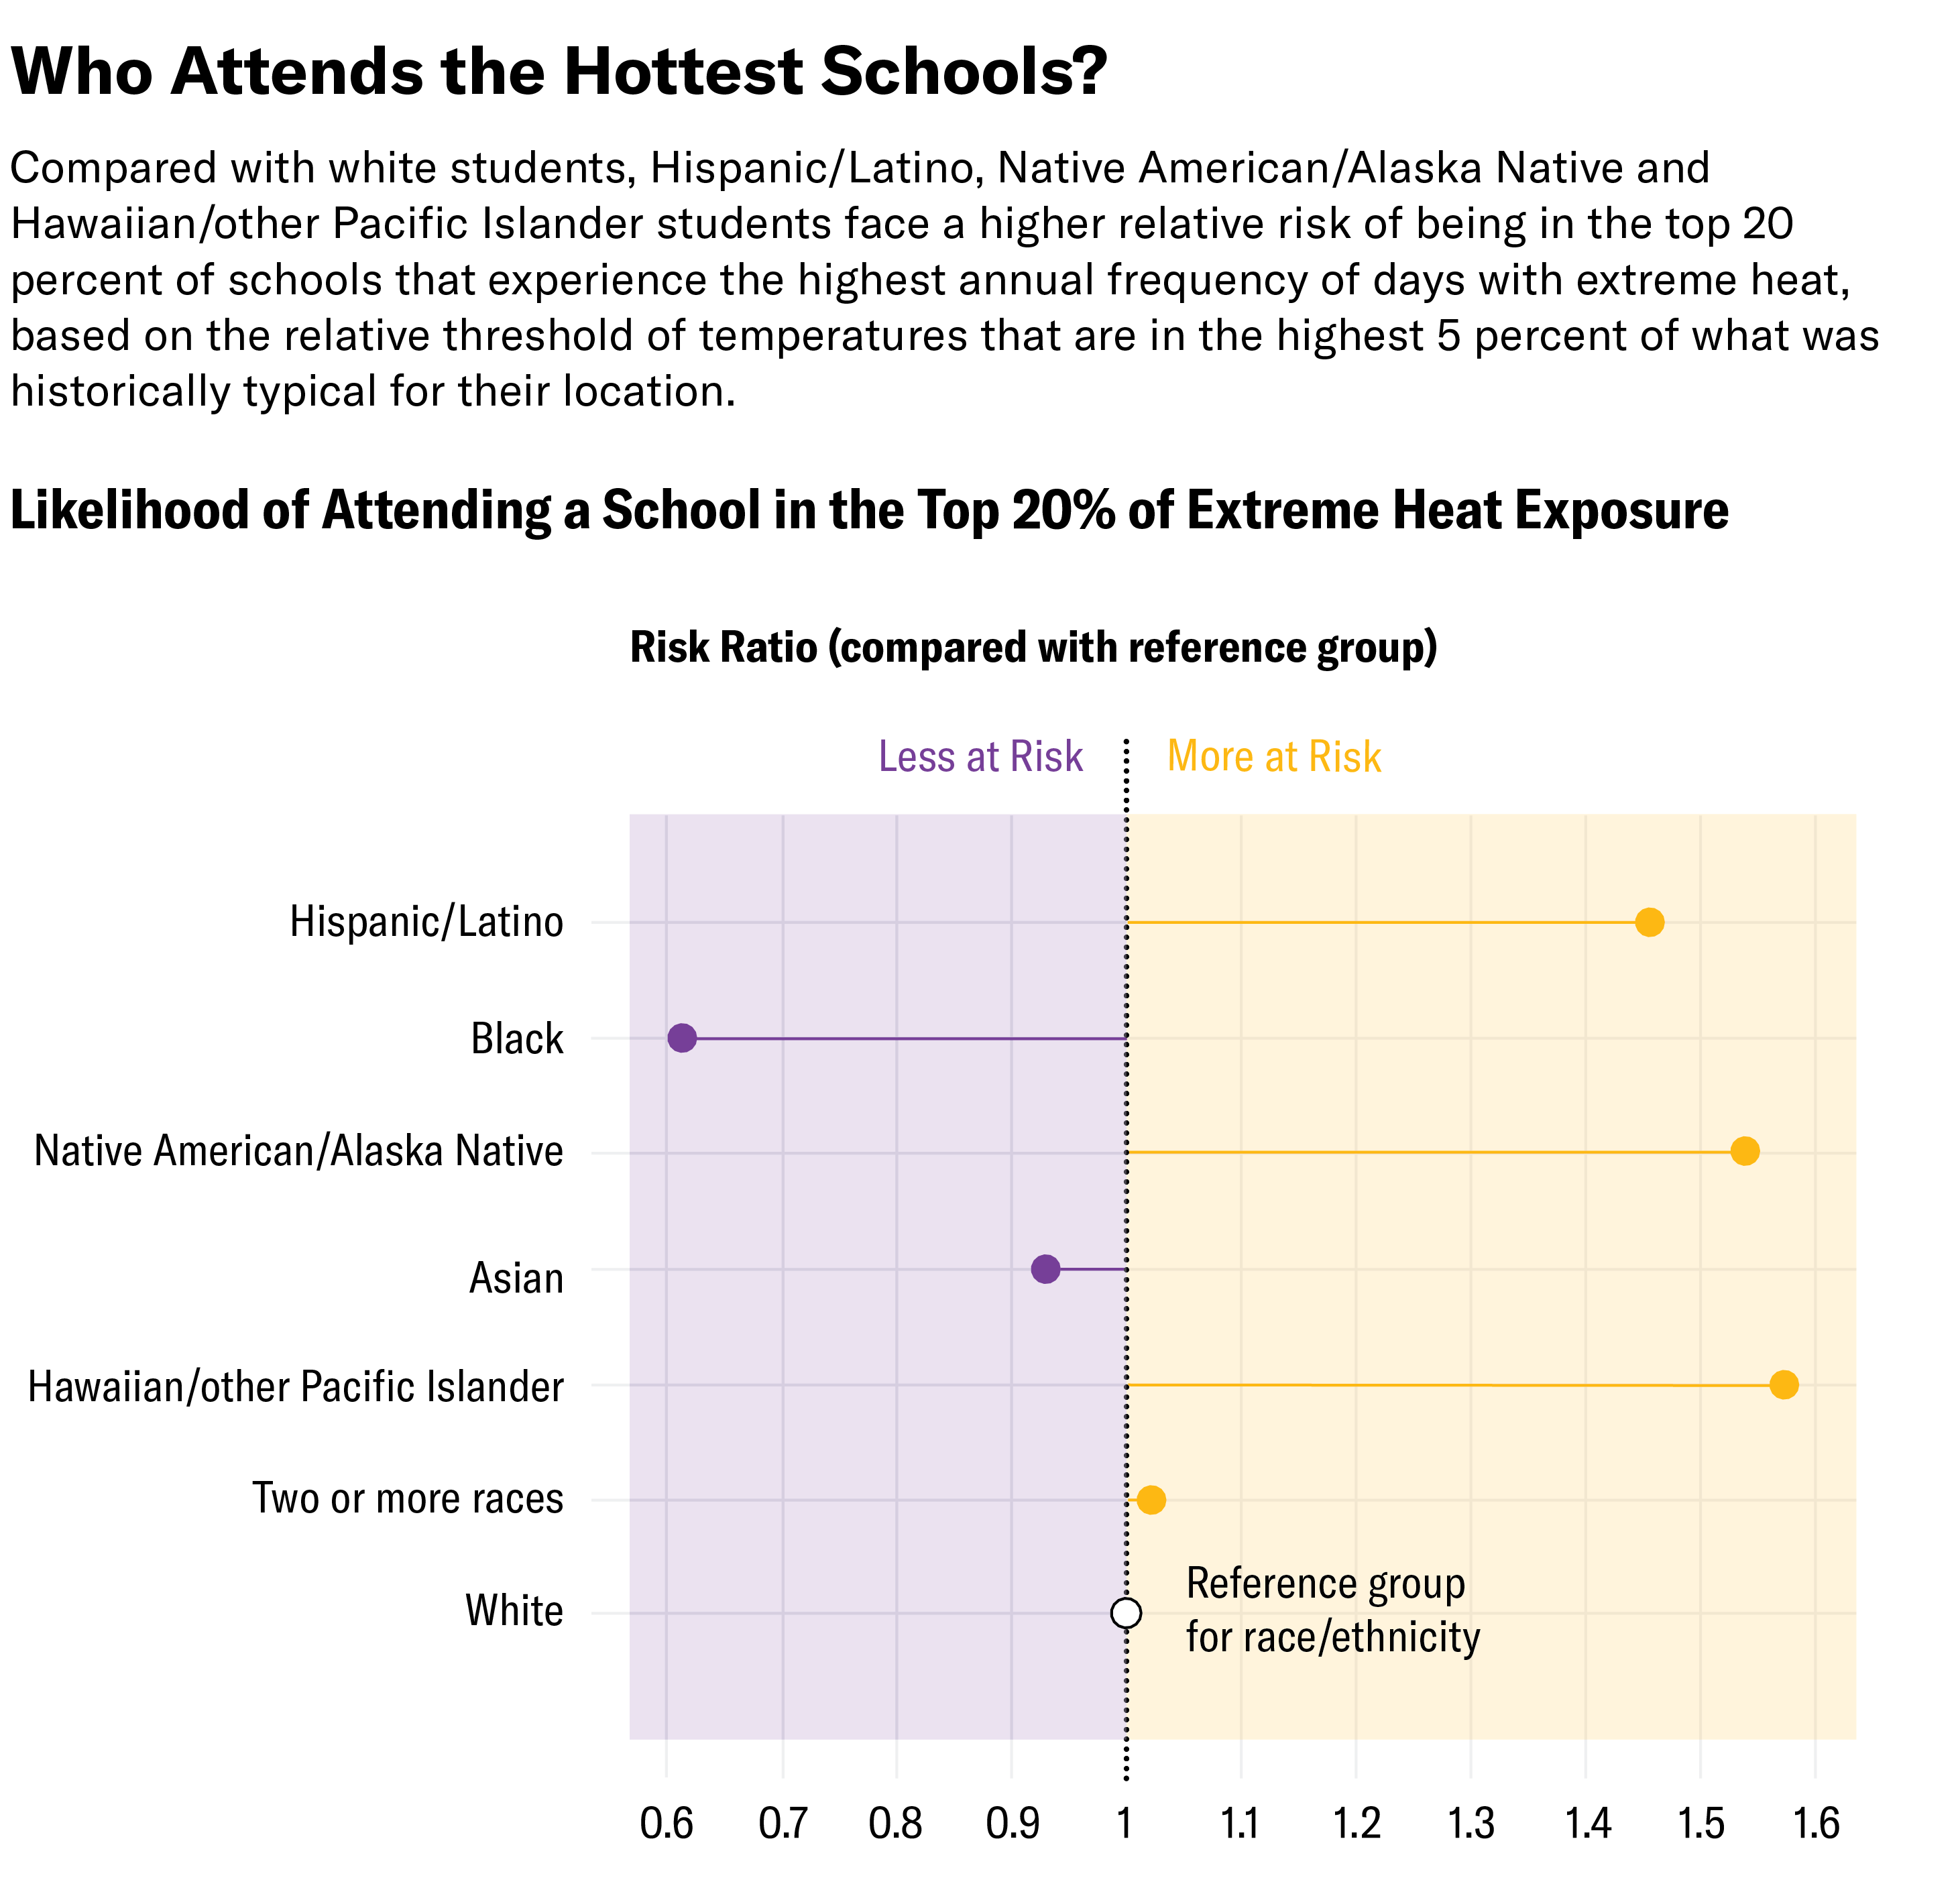
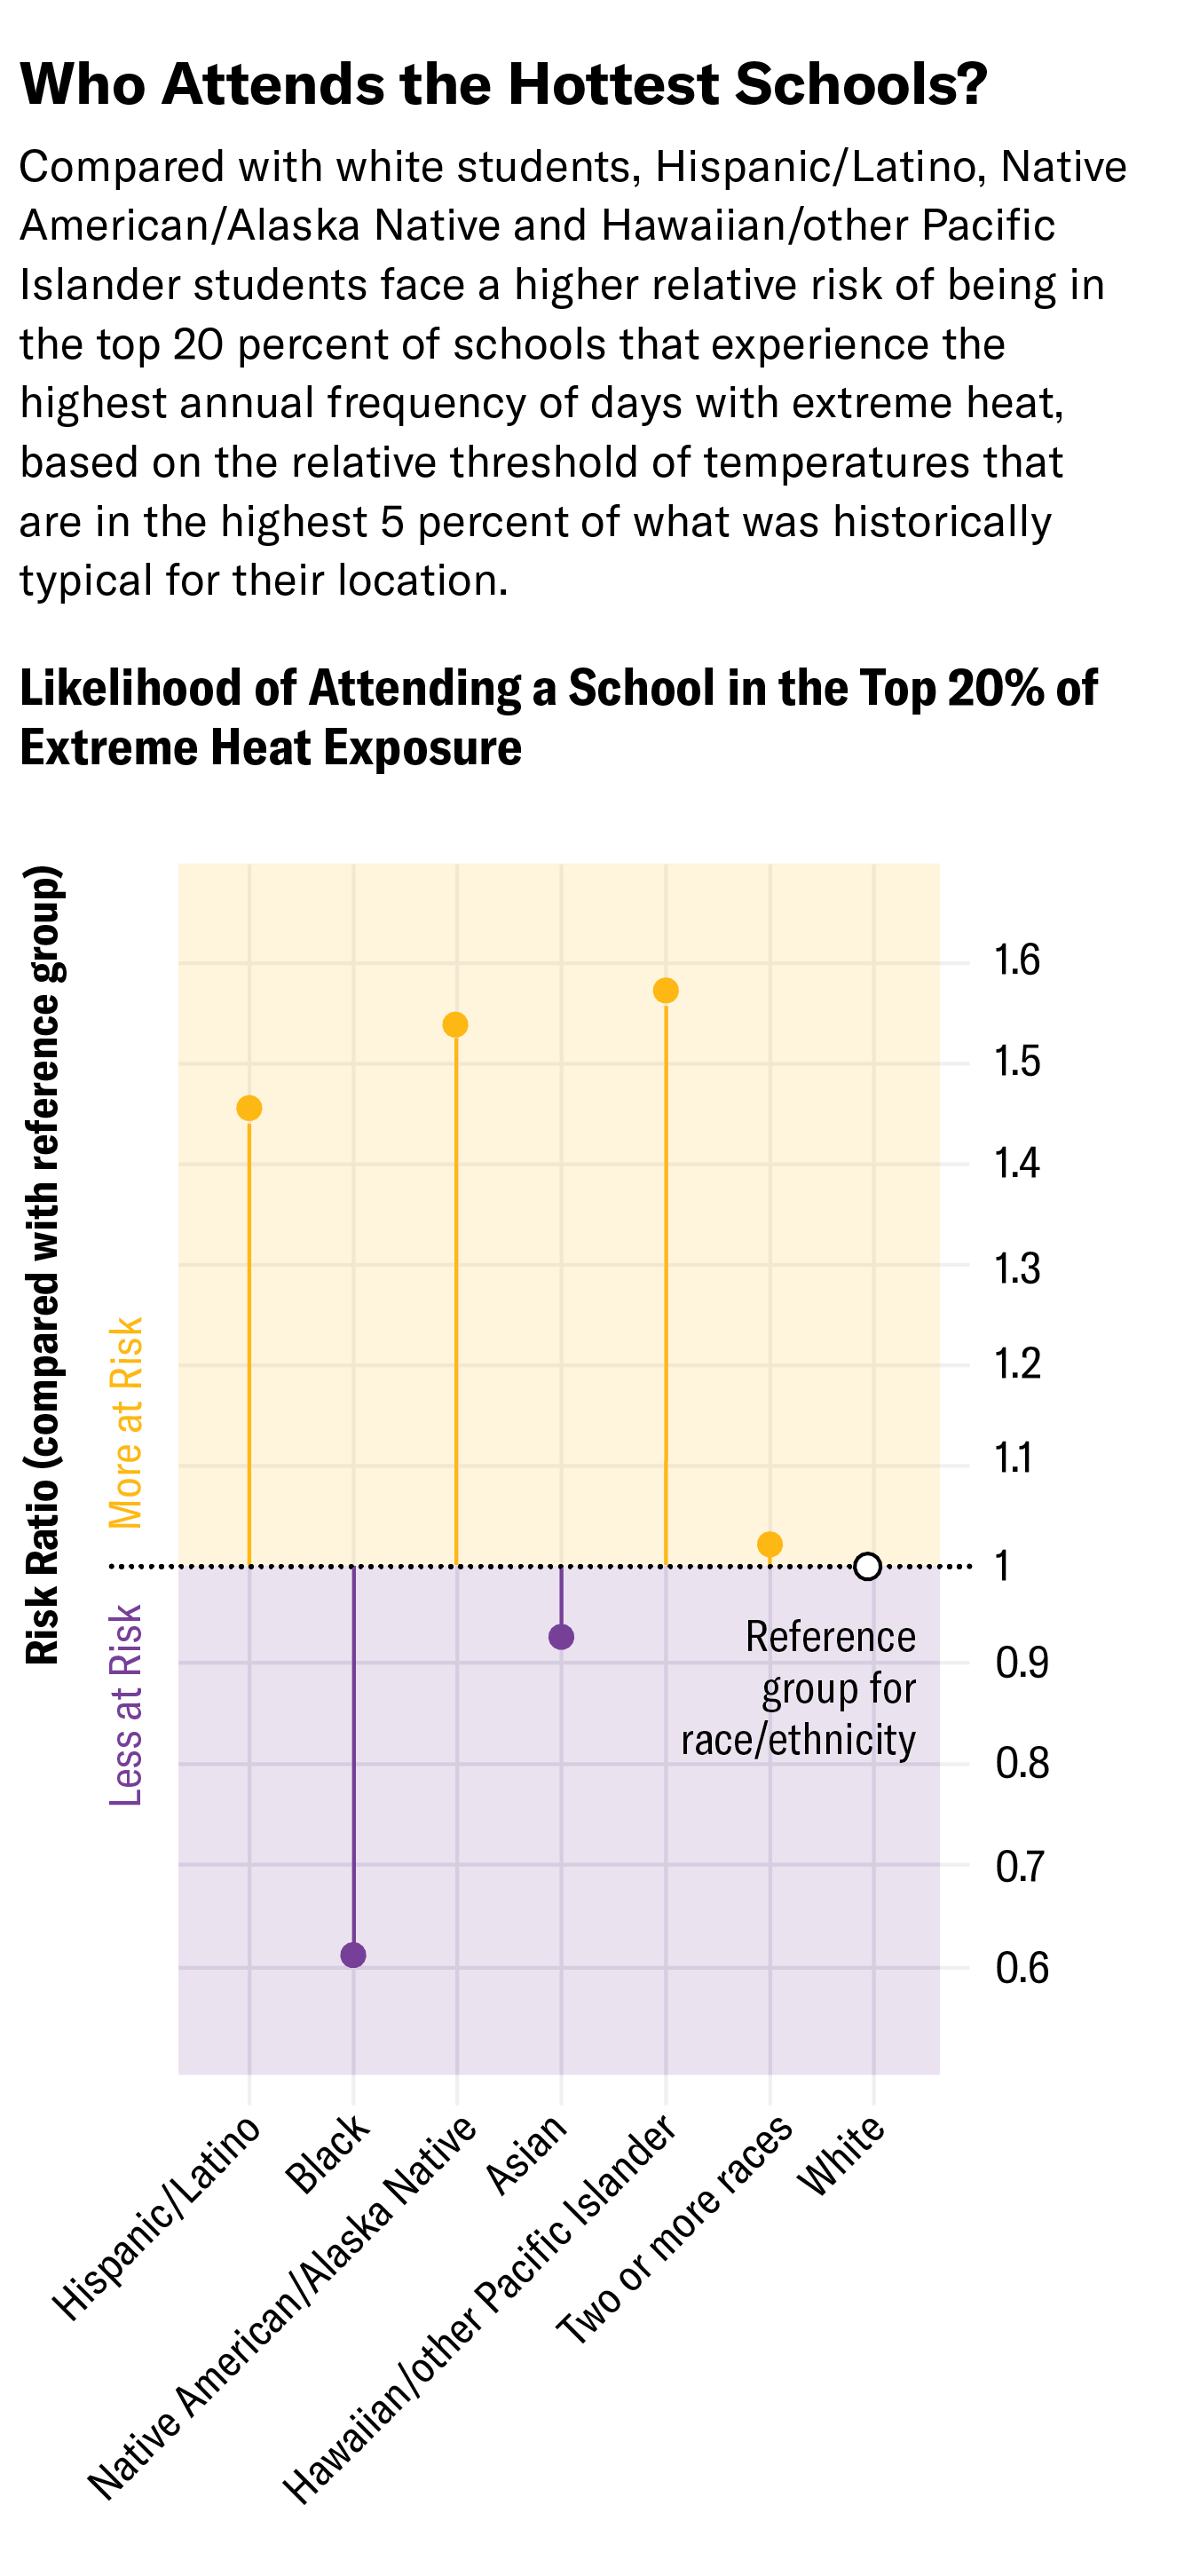
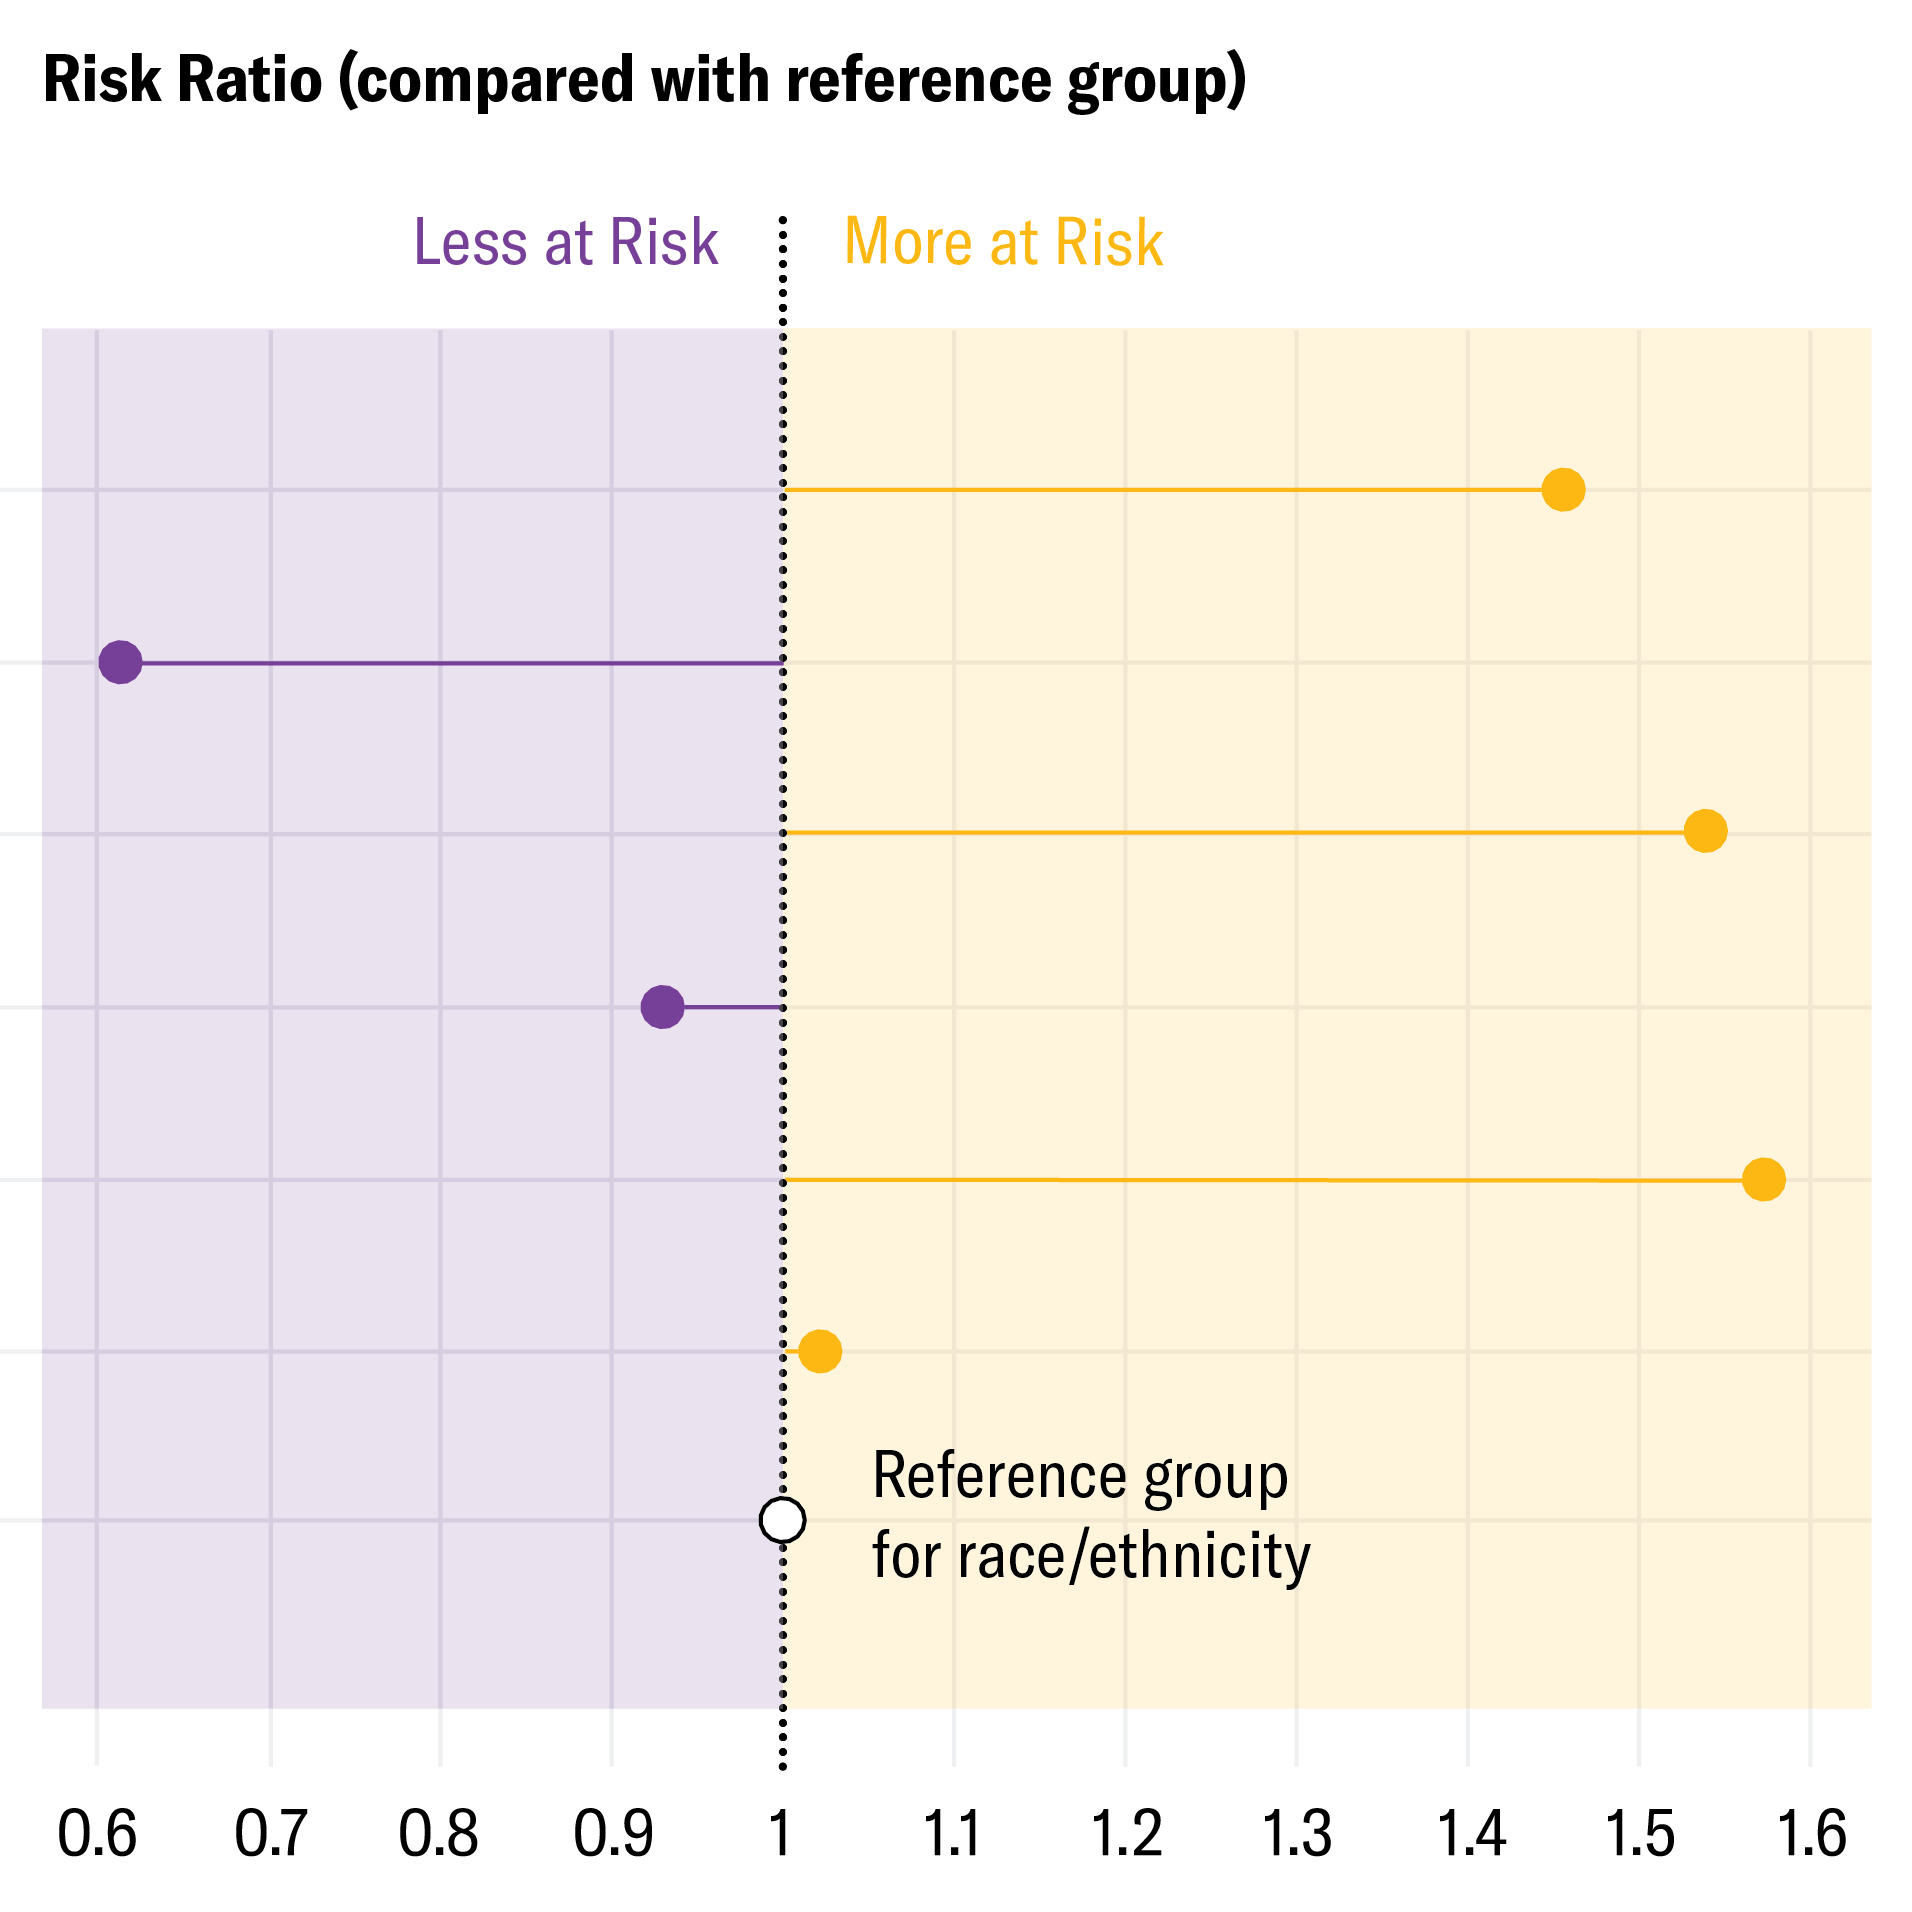
For a Scientific American story Kids from Marginalized Communities Are Learning in the Hottest Classrooms by Humberto Basilio, I made a graphic sourcing the data from a recent study that looks into the social disparities spotted in the annual frequency of extreme heat days across the top 20% of U.S. public schools.
The chart shows, compared to white students, Hispanic/Latino, Native American/Alaska Native and Hawaiian/other Pacific Islander students are at a higher relative risk than white students of attending the top 20 percent of U.S. schools that experience the highest annual frequency of days with extreme heat, based on the relative threshold of temperatures that are in the highest 5 percent of what was historically typical for their location.
(Click the arrows to see both desktop and mobile versions)
More Teens Are Getting Vaccines
August 2025 • Scientific American
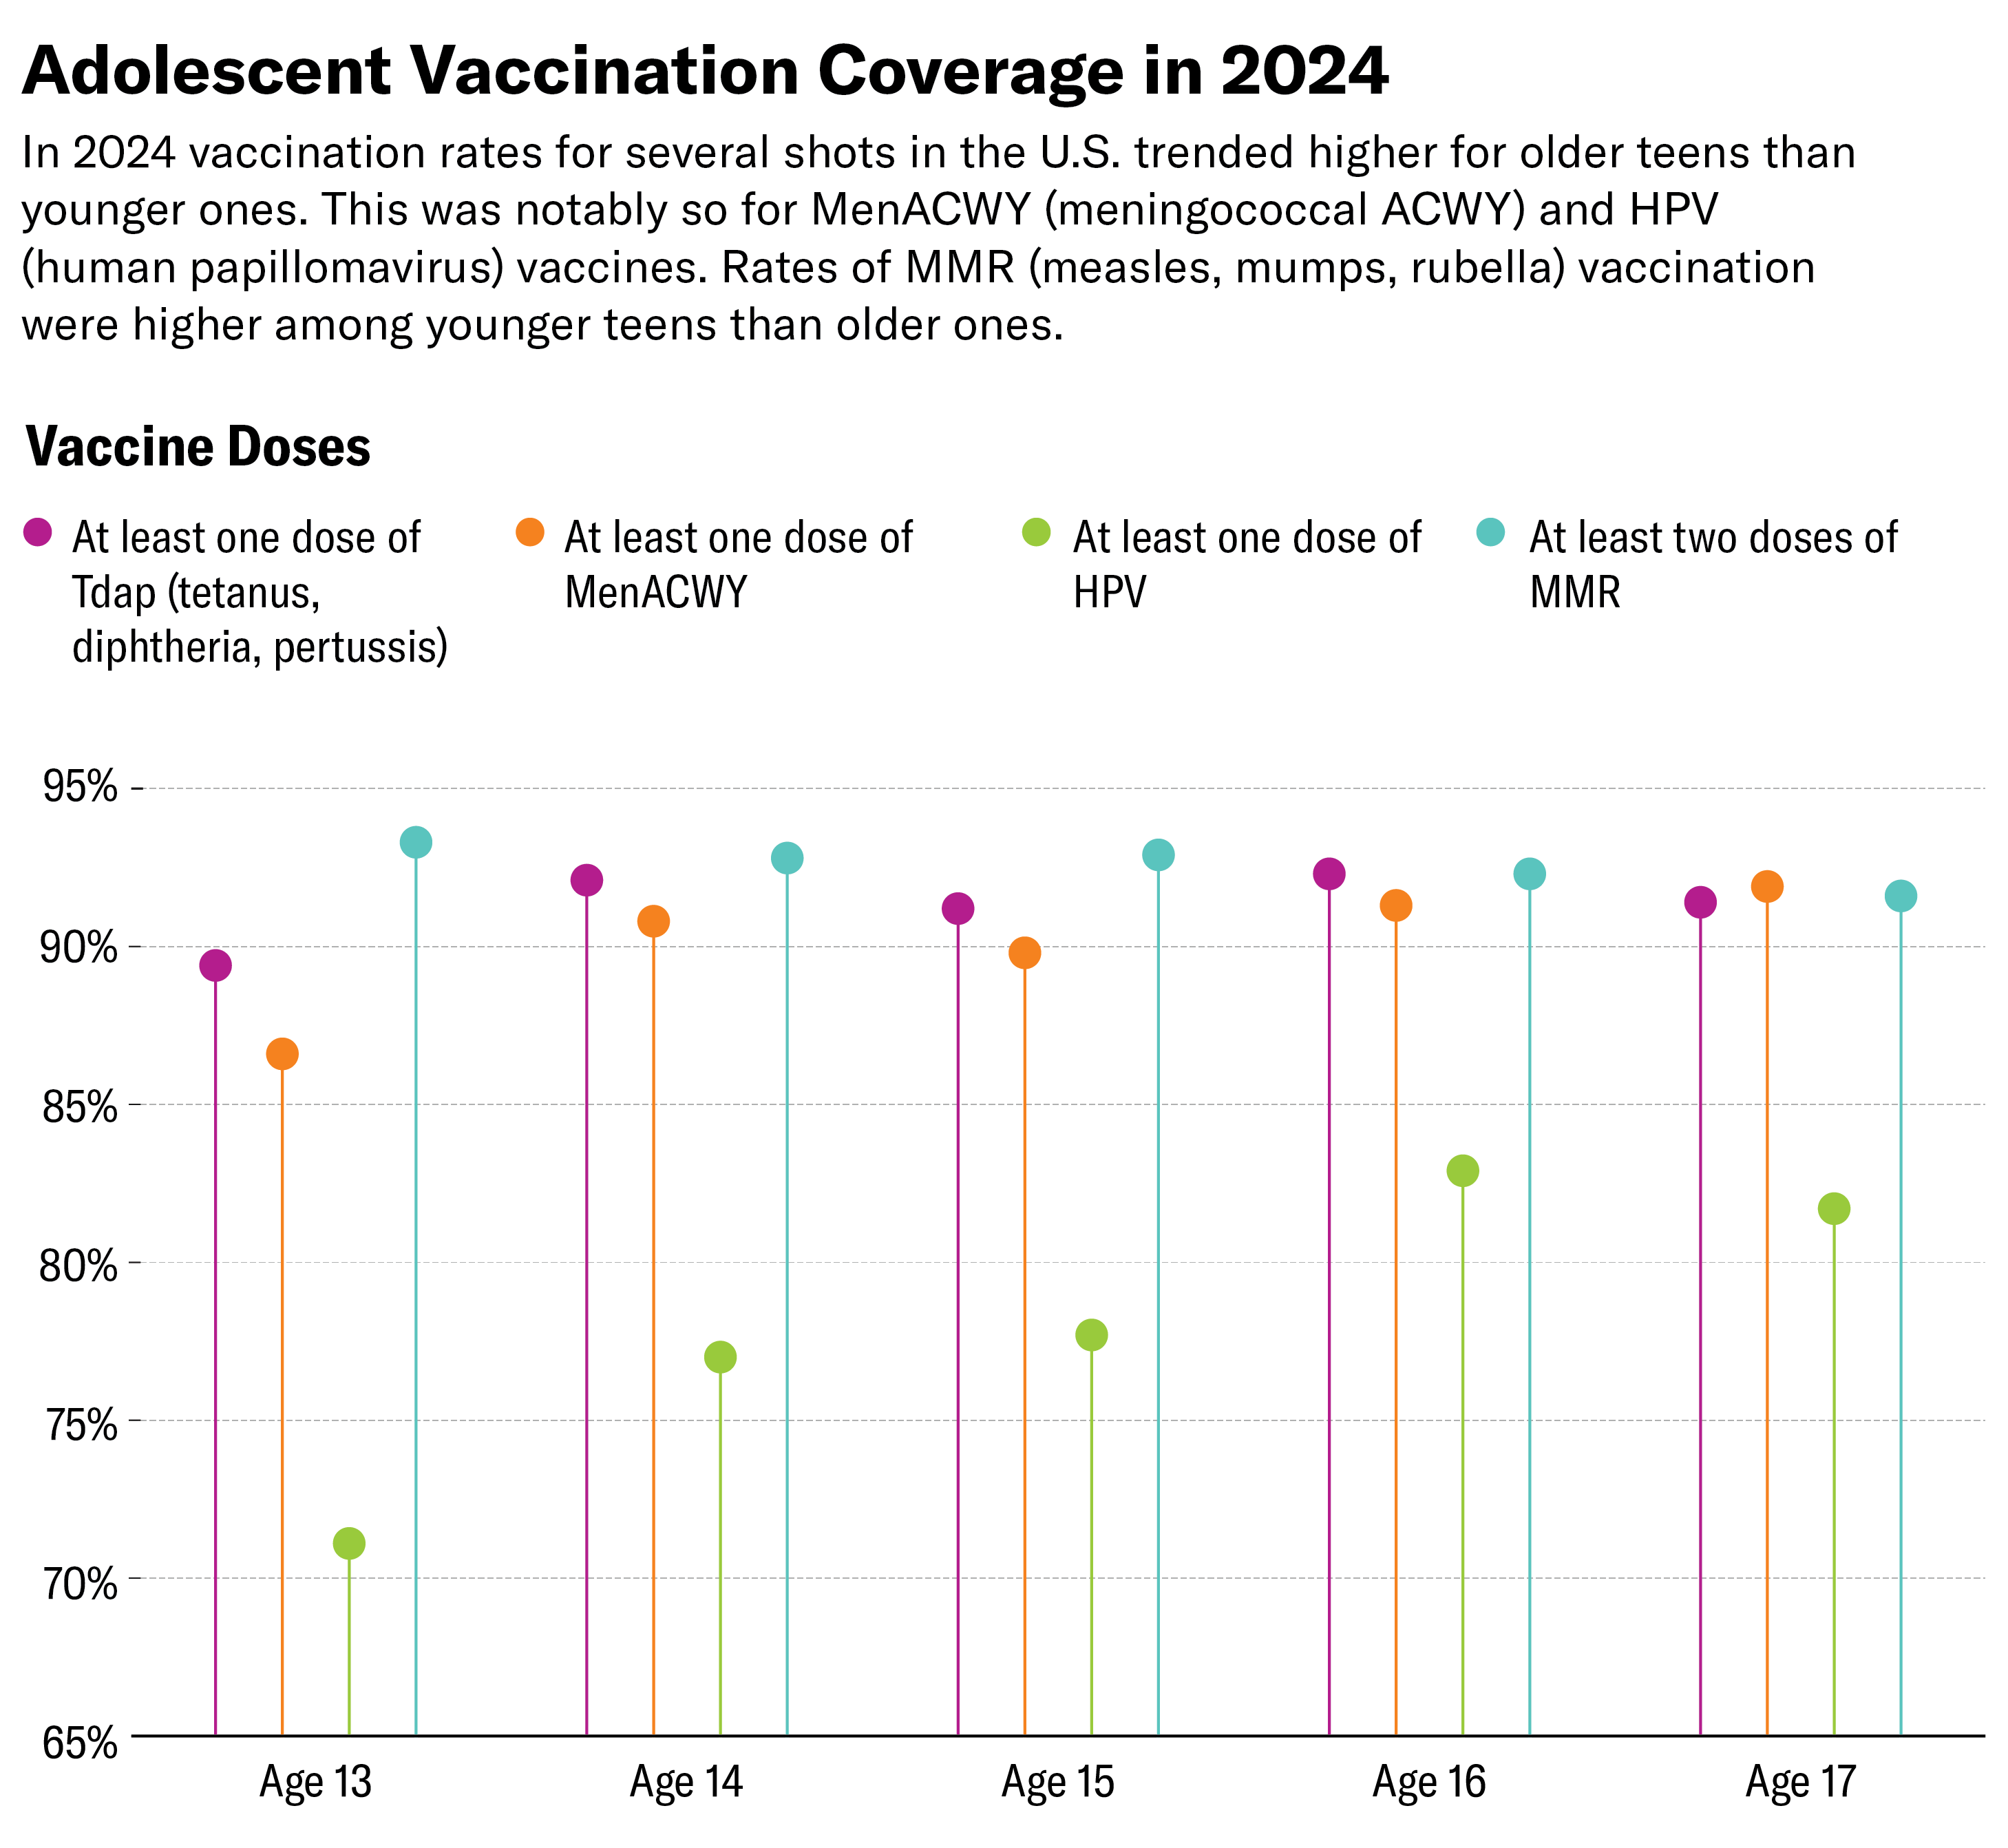
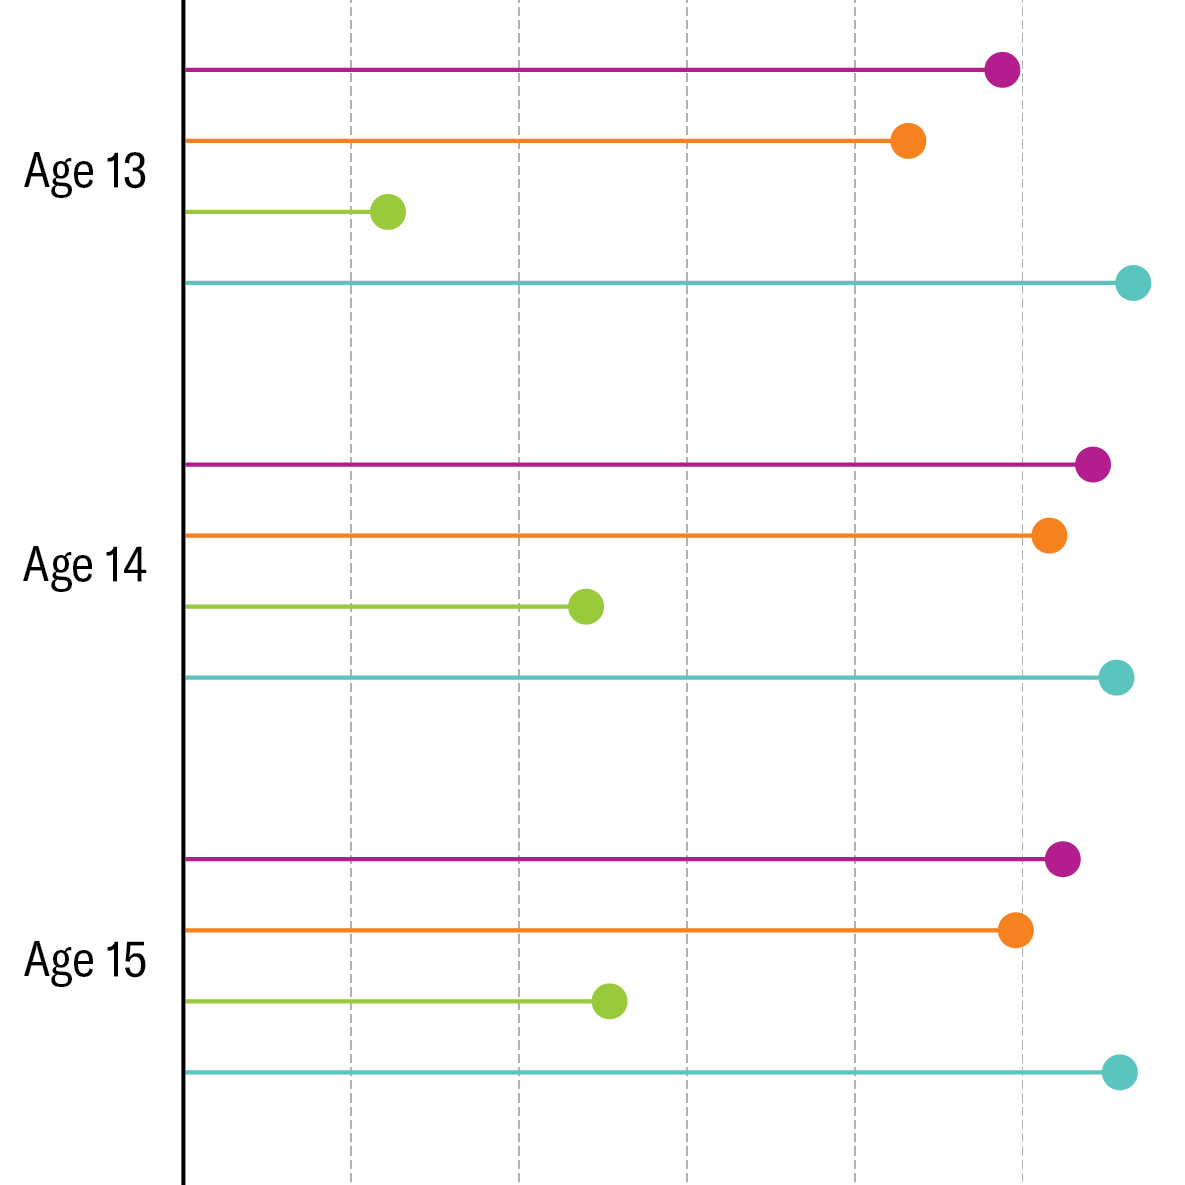
For a Scientific American story More Teens Are Getting Vaccines by Megha Satyanarayana, I made two graphics that uses data from a CDC Weekly Report published on August 14, 2025, looking into a general higher trend of vaccination rates among U.S. teens aged from 13 to 17.
First chart has shown that in 2024 vaccination coverage for Tdap, MenACWY, HPV and MMR vaccines trended higher for older teens than younger ones.
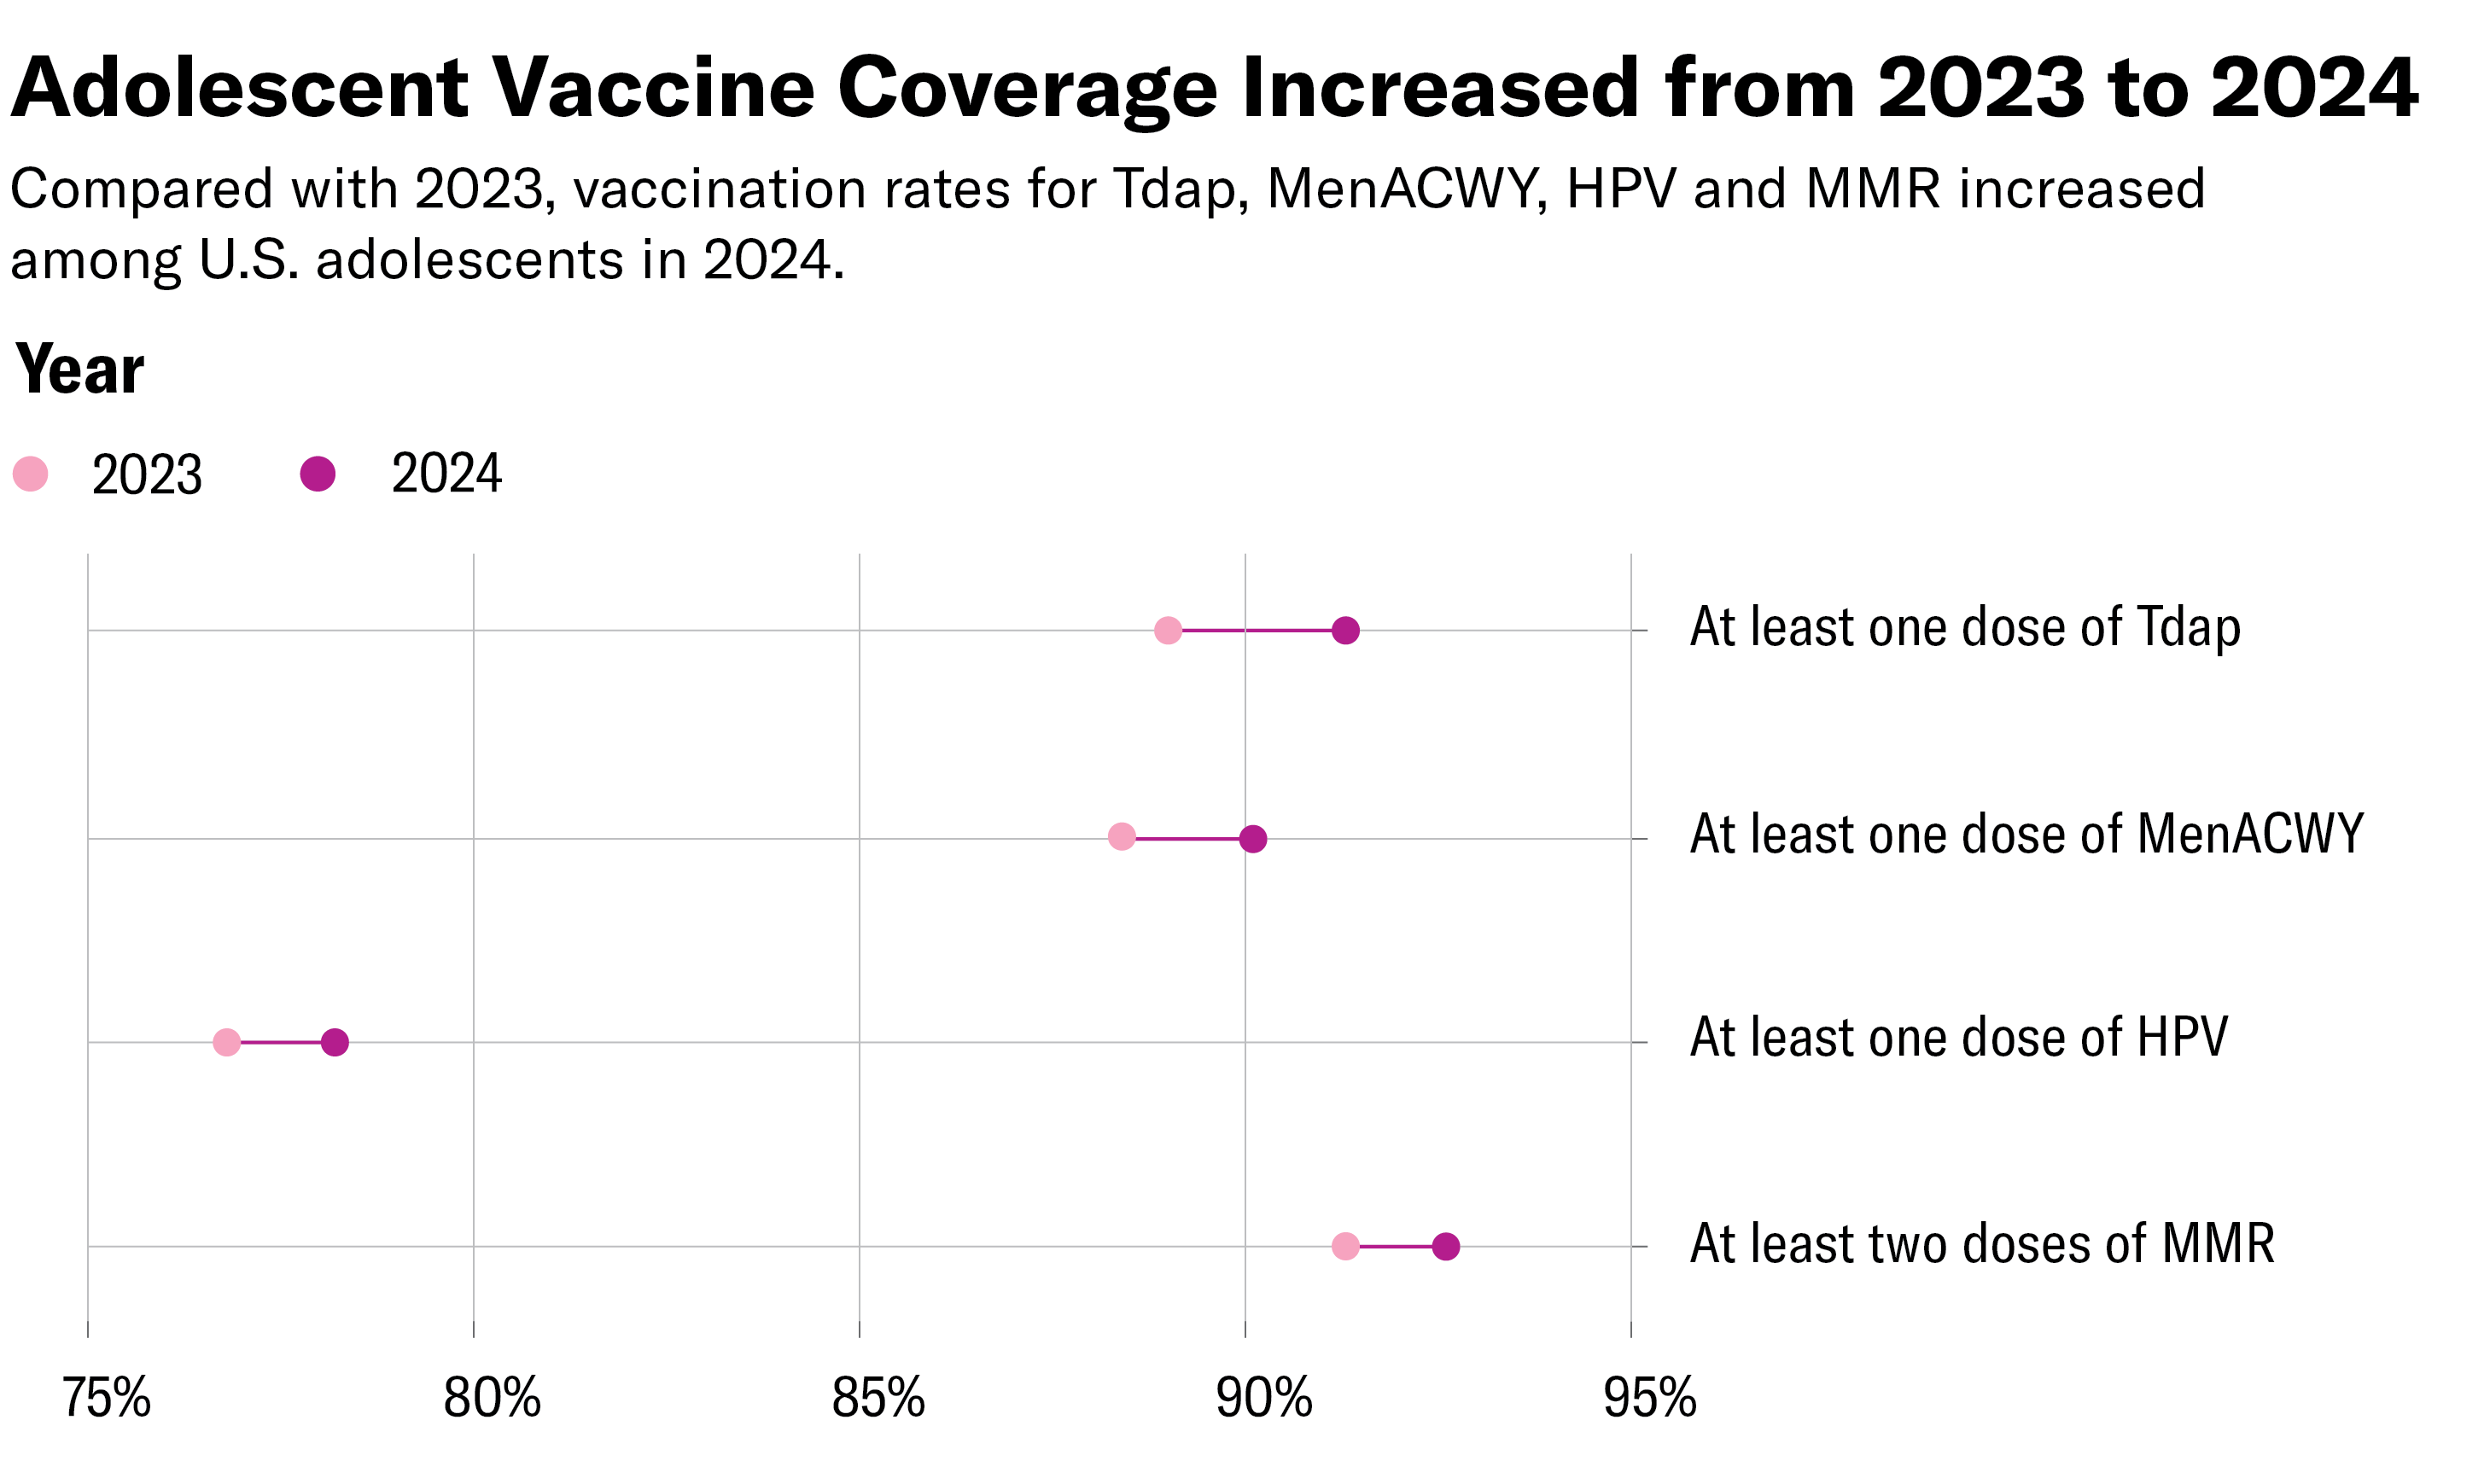
Second chart points out that there is an increasing vaccination rate among U.S. adolescents aged 13 to 17 from 2023 to 2024, with the largest gain in at least one dose of the Tdap vaccine (from 89% to 91.3%), followed by at least one dose of MenACWY, HPV and at least two doses of MMR.
Where Did Bird Flu Go?
July 2025 • Scientific American
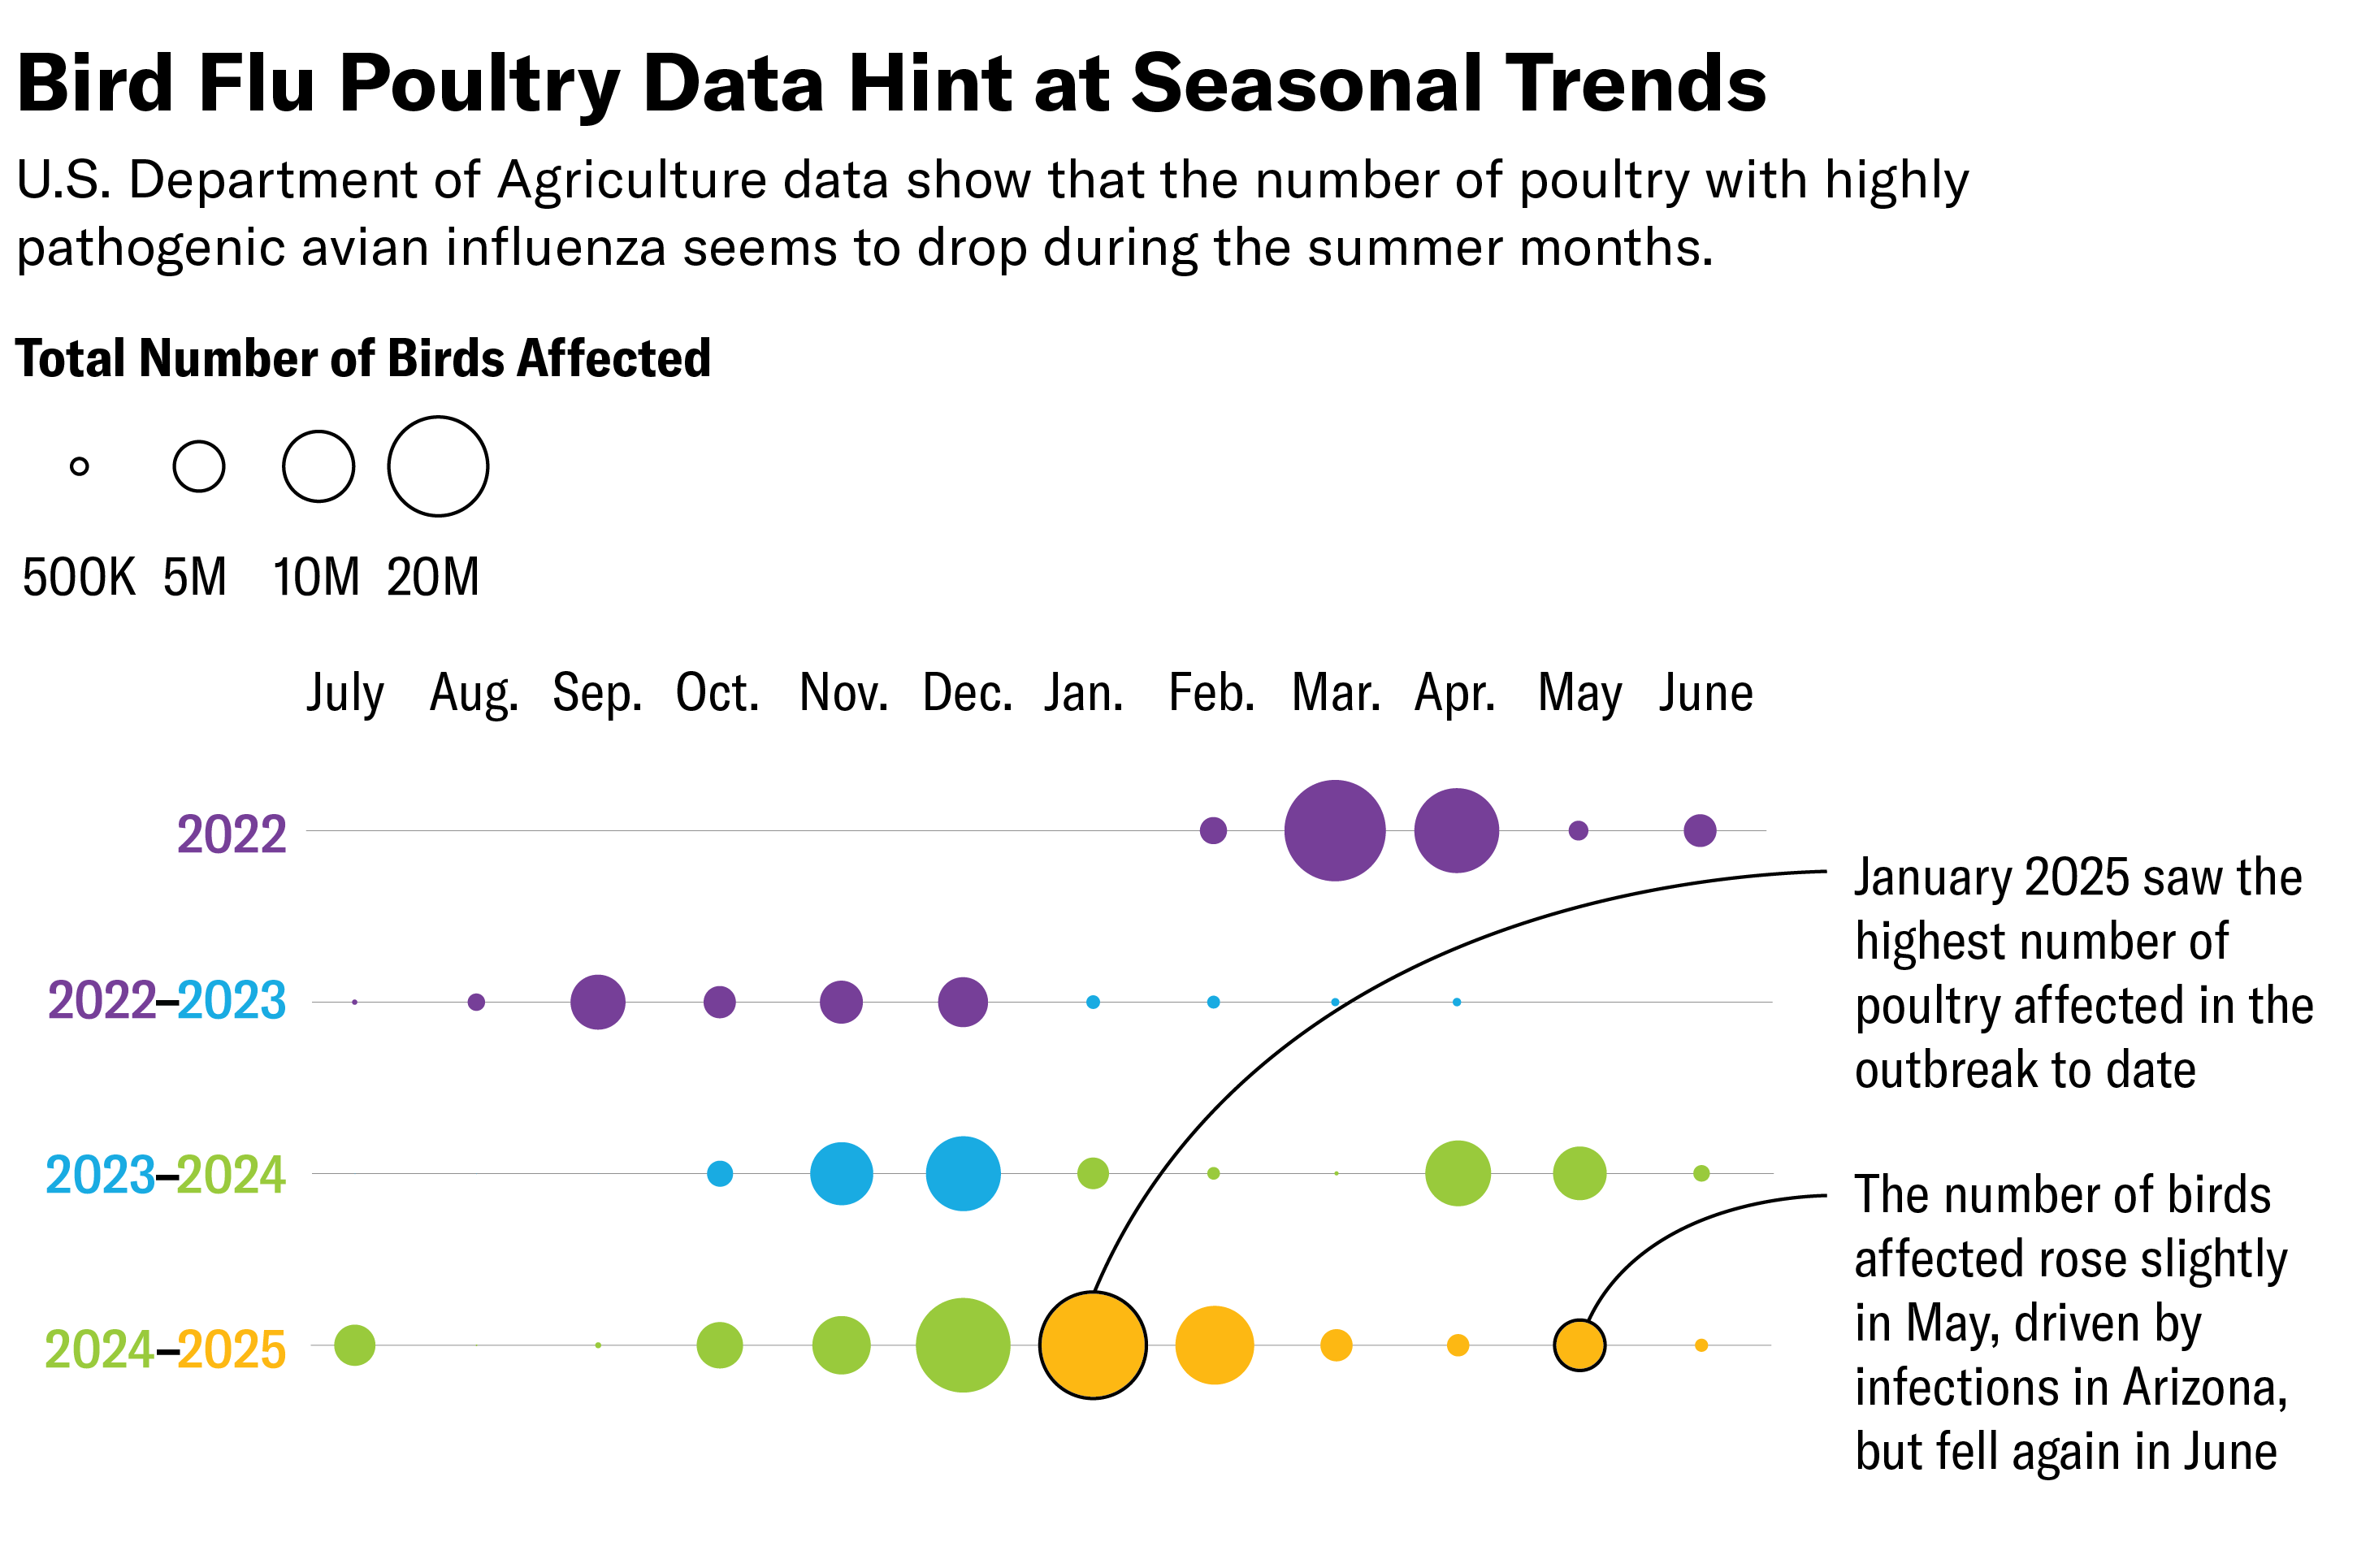
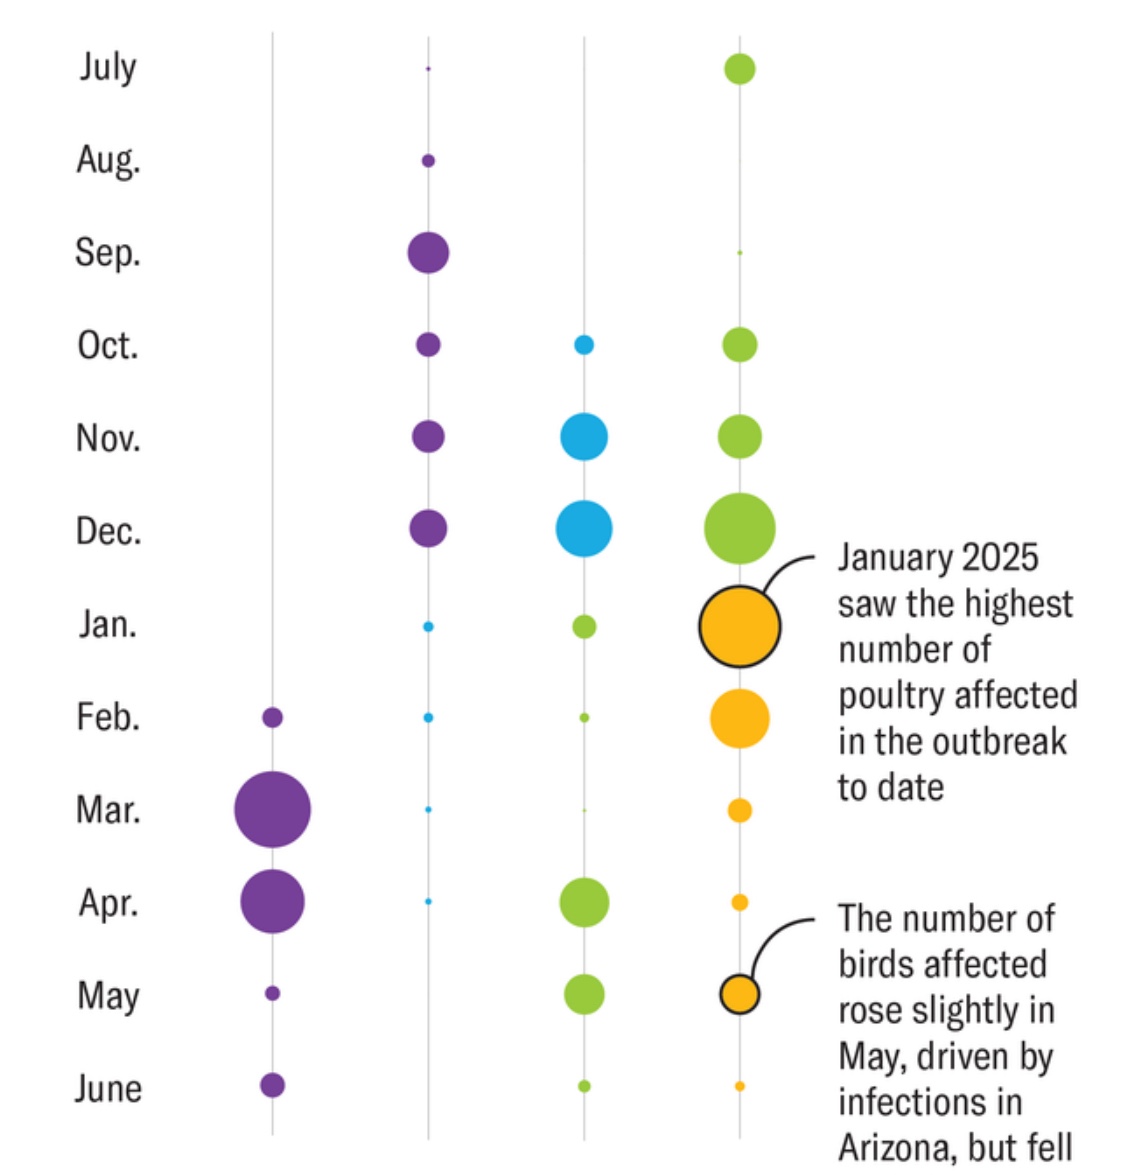
For a Scientific American story Where Did Bird Flu Go? by Meghan Bartels, I created a graphic showing how cases of highly pathogenic avian influenza in poultry tend to decline during the summer months, based on USDA data from 2022 to 2025.
Experts suggest two main reasons for this seasonal drop: the virus doesn't thrive in warmer temperatures, and during the breeding season, migratory birds are less active near poultry farms, potentially slowing transmission.
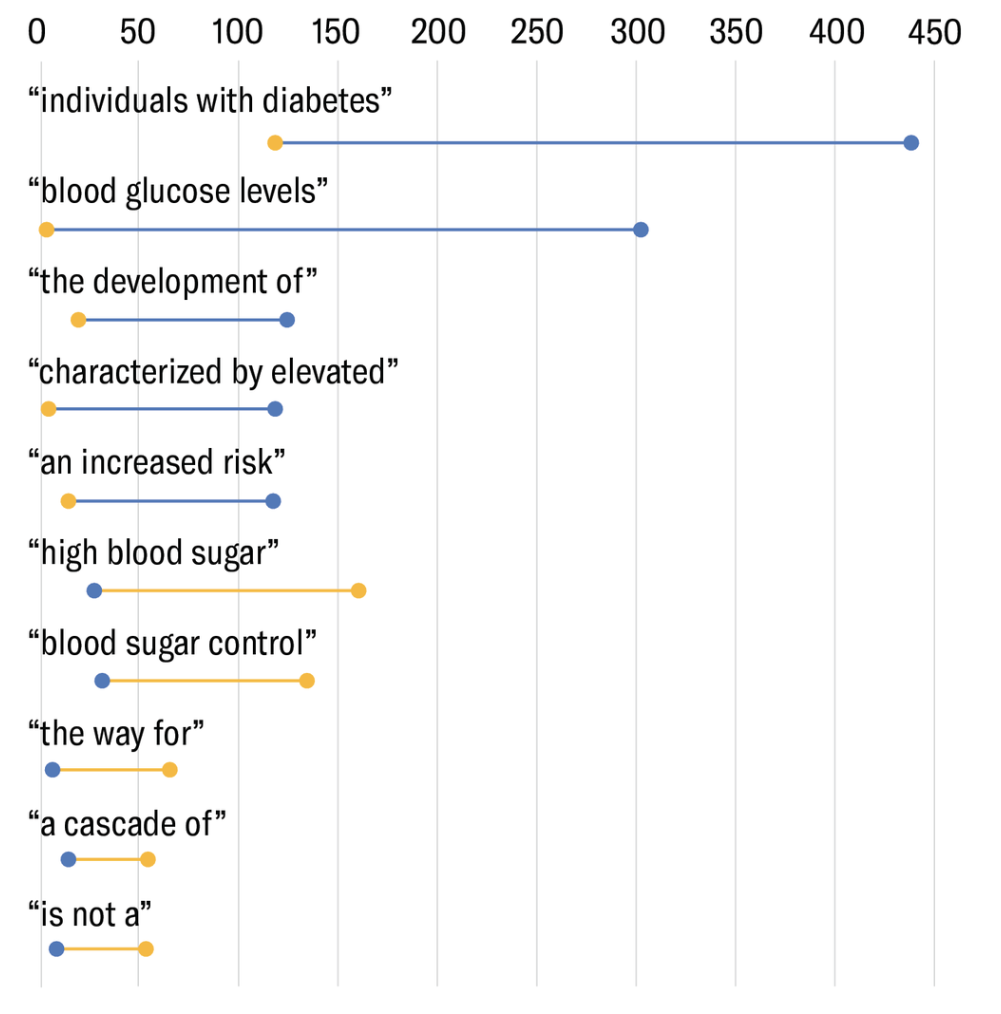
AI Chatbots Write in Different Idioms
June 2025 • Scientific American
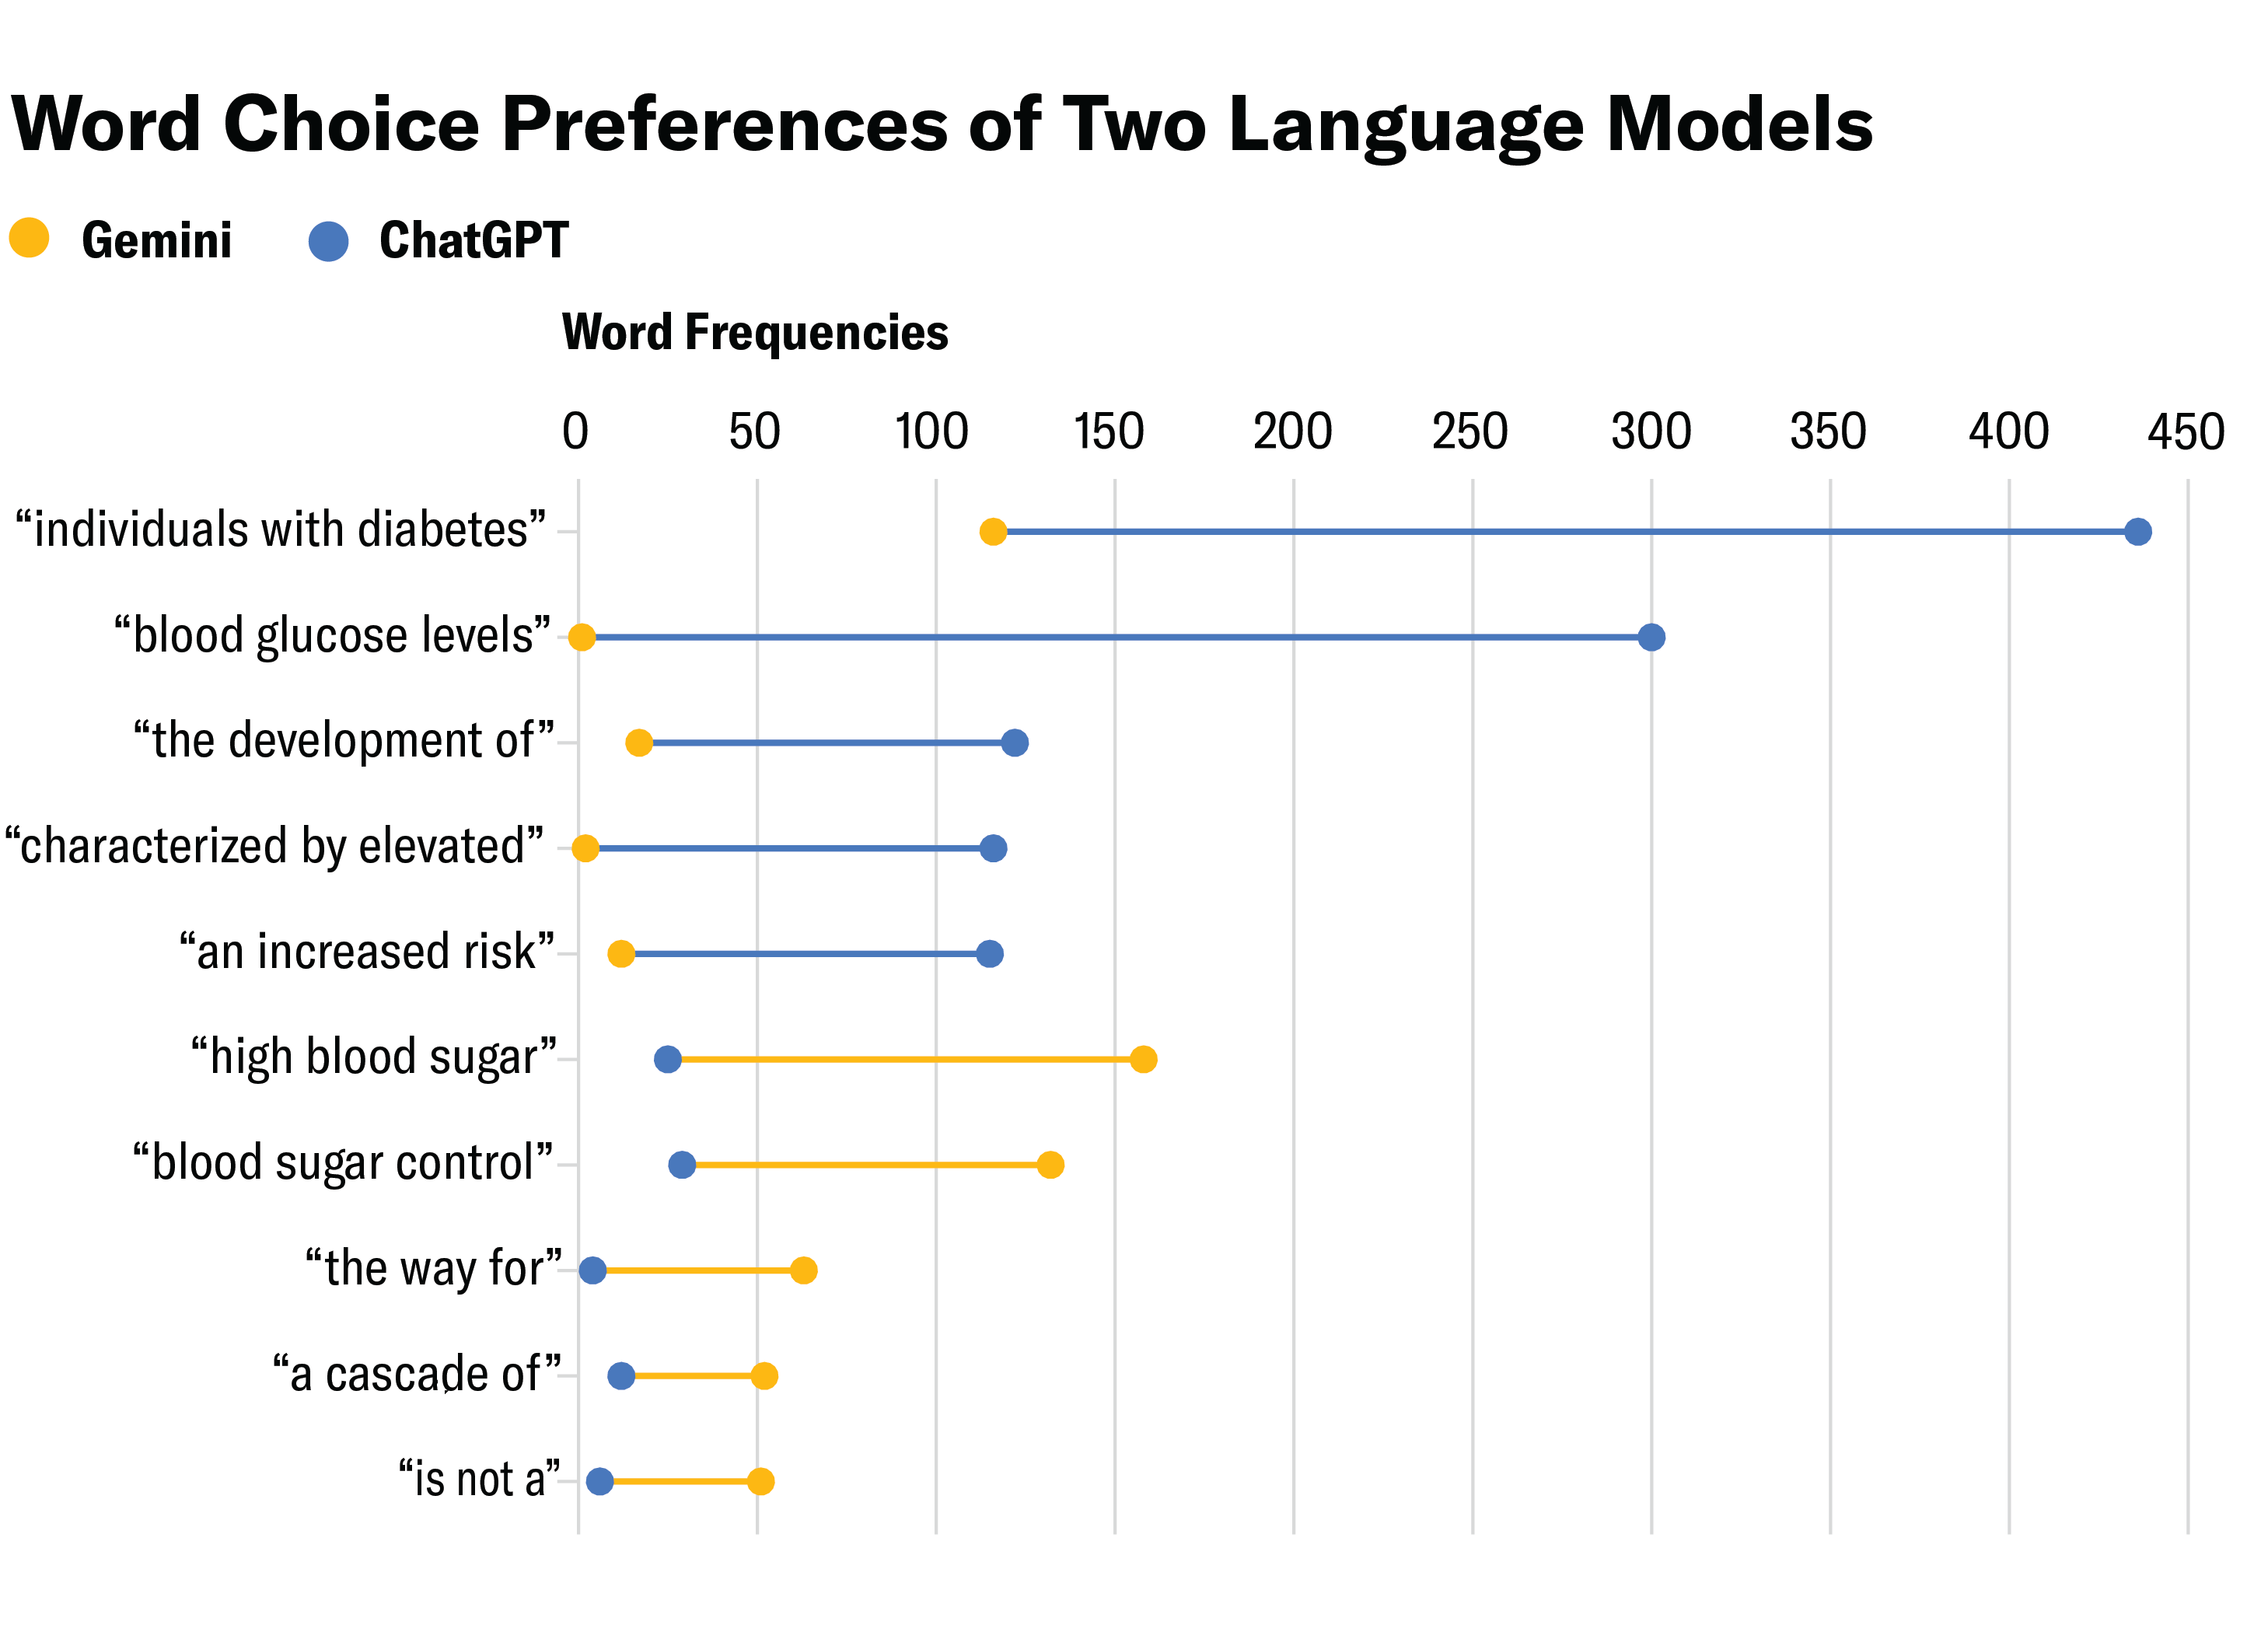
For a Scientific American story Each AI Chatbot Has Its Own Distinctive Writing Style by Karolina Rudnicka, I made a graphic that explores how ChatGPT and Gemini differ in their word choice preferences.
For instance, “idiolect,” a narrower concept than “dialect,” refers to an individual’s unique speaking style. The author analyzed 20 of the most frequent short texts on diabetes generated by both models and found they have distinct writing styles. Gemini favors simple, direct language like “high blood sugar,” while ChatGPT tends to lean toward more formal word combination such as “blood glucose levels.”
3D Geospatial Modeling
August 2025 • Personal
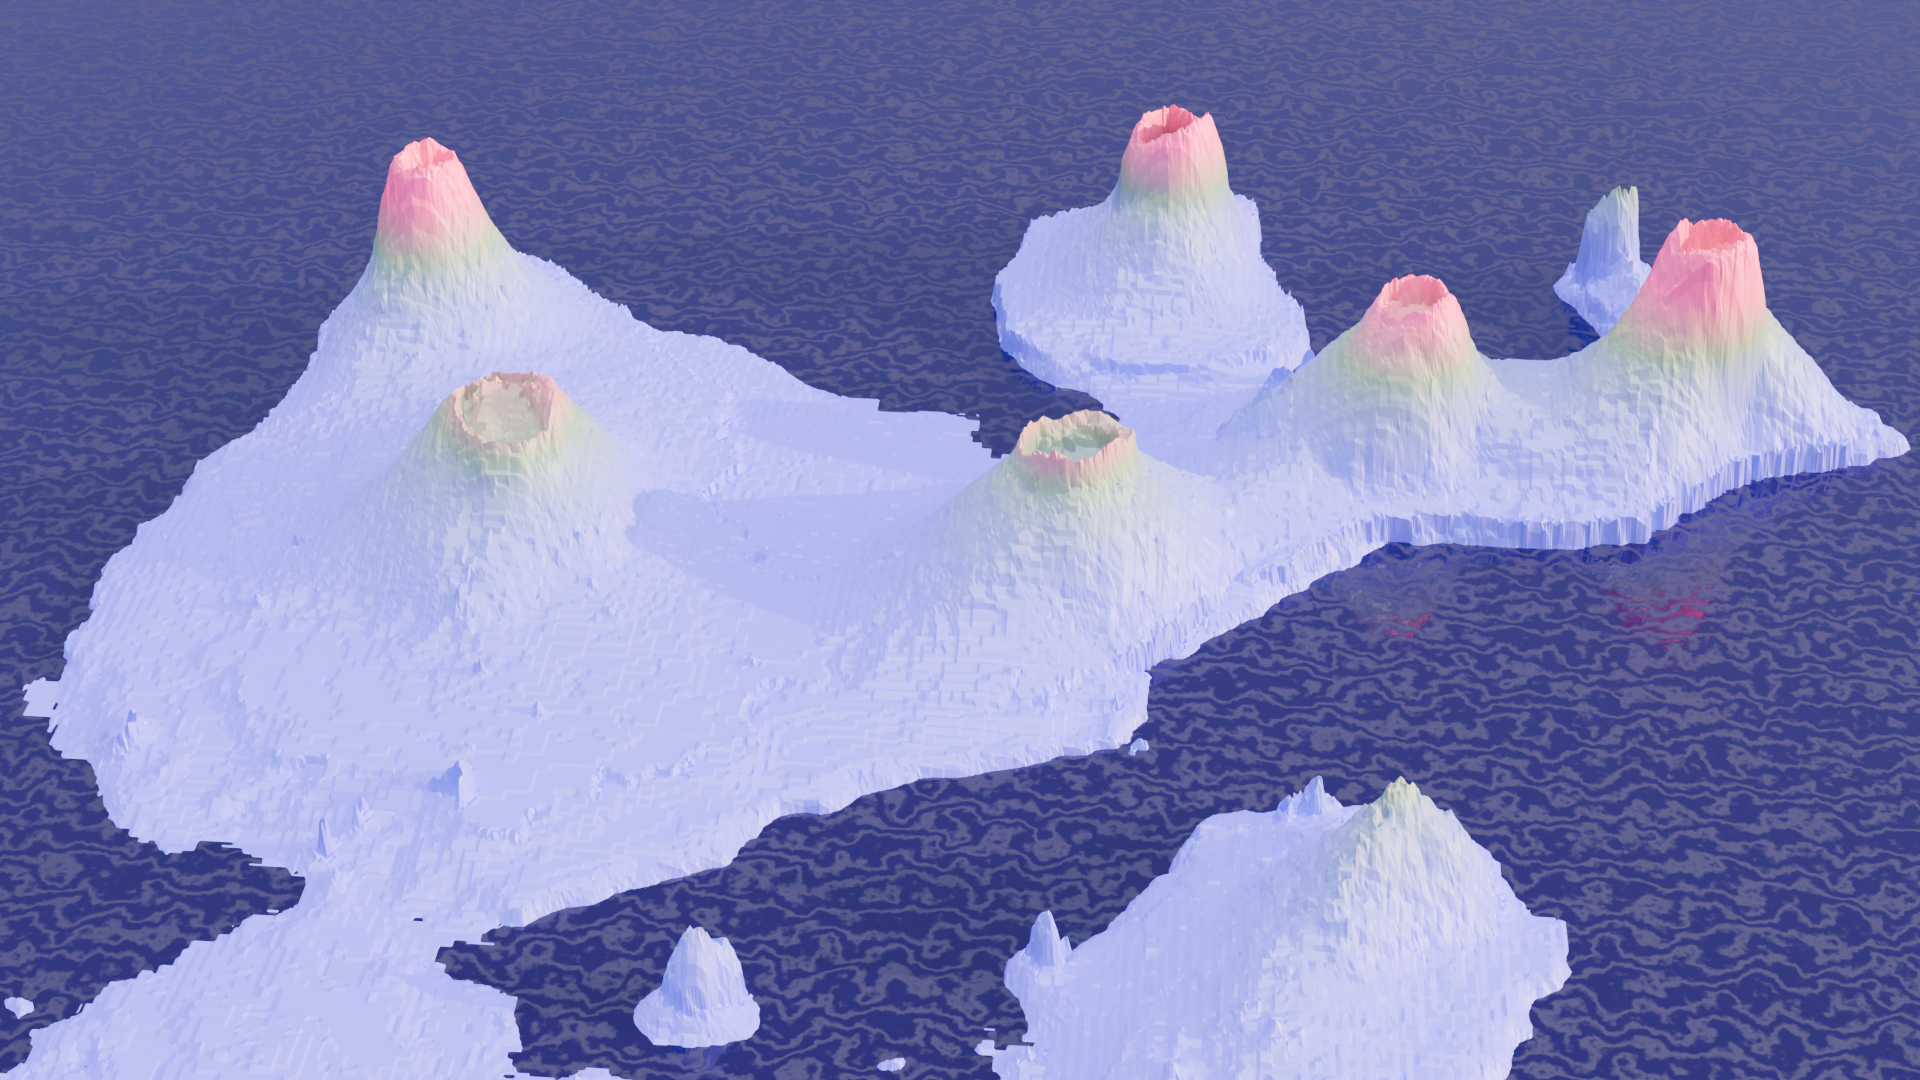
This visualization was my first attempt using Blender in combination with QGIS to render real geographic data as 3D models. I used the Galápagos Islands in Ecuador as a case study. It is also part of the Blender 3D Geospatial Modeling training by Elizabeth Rosenbloom at The School of Information Design
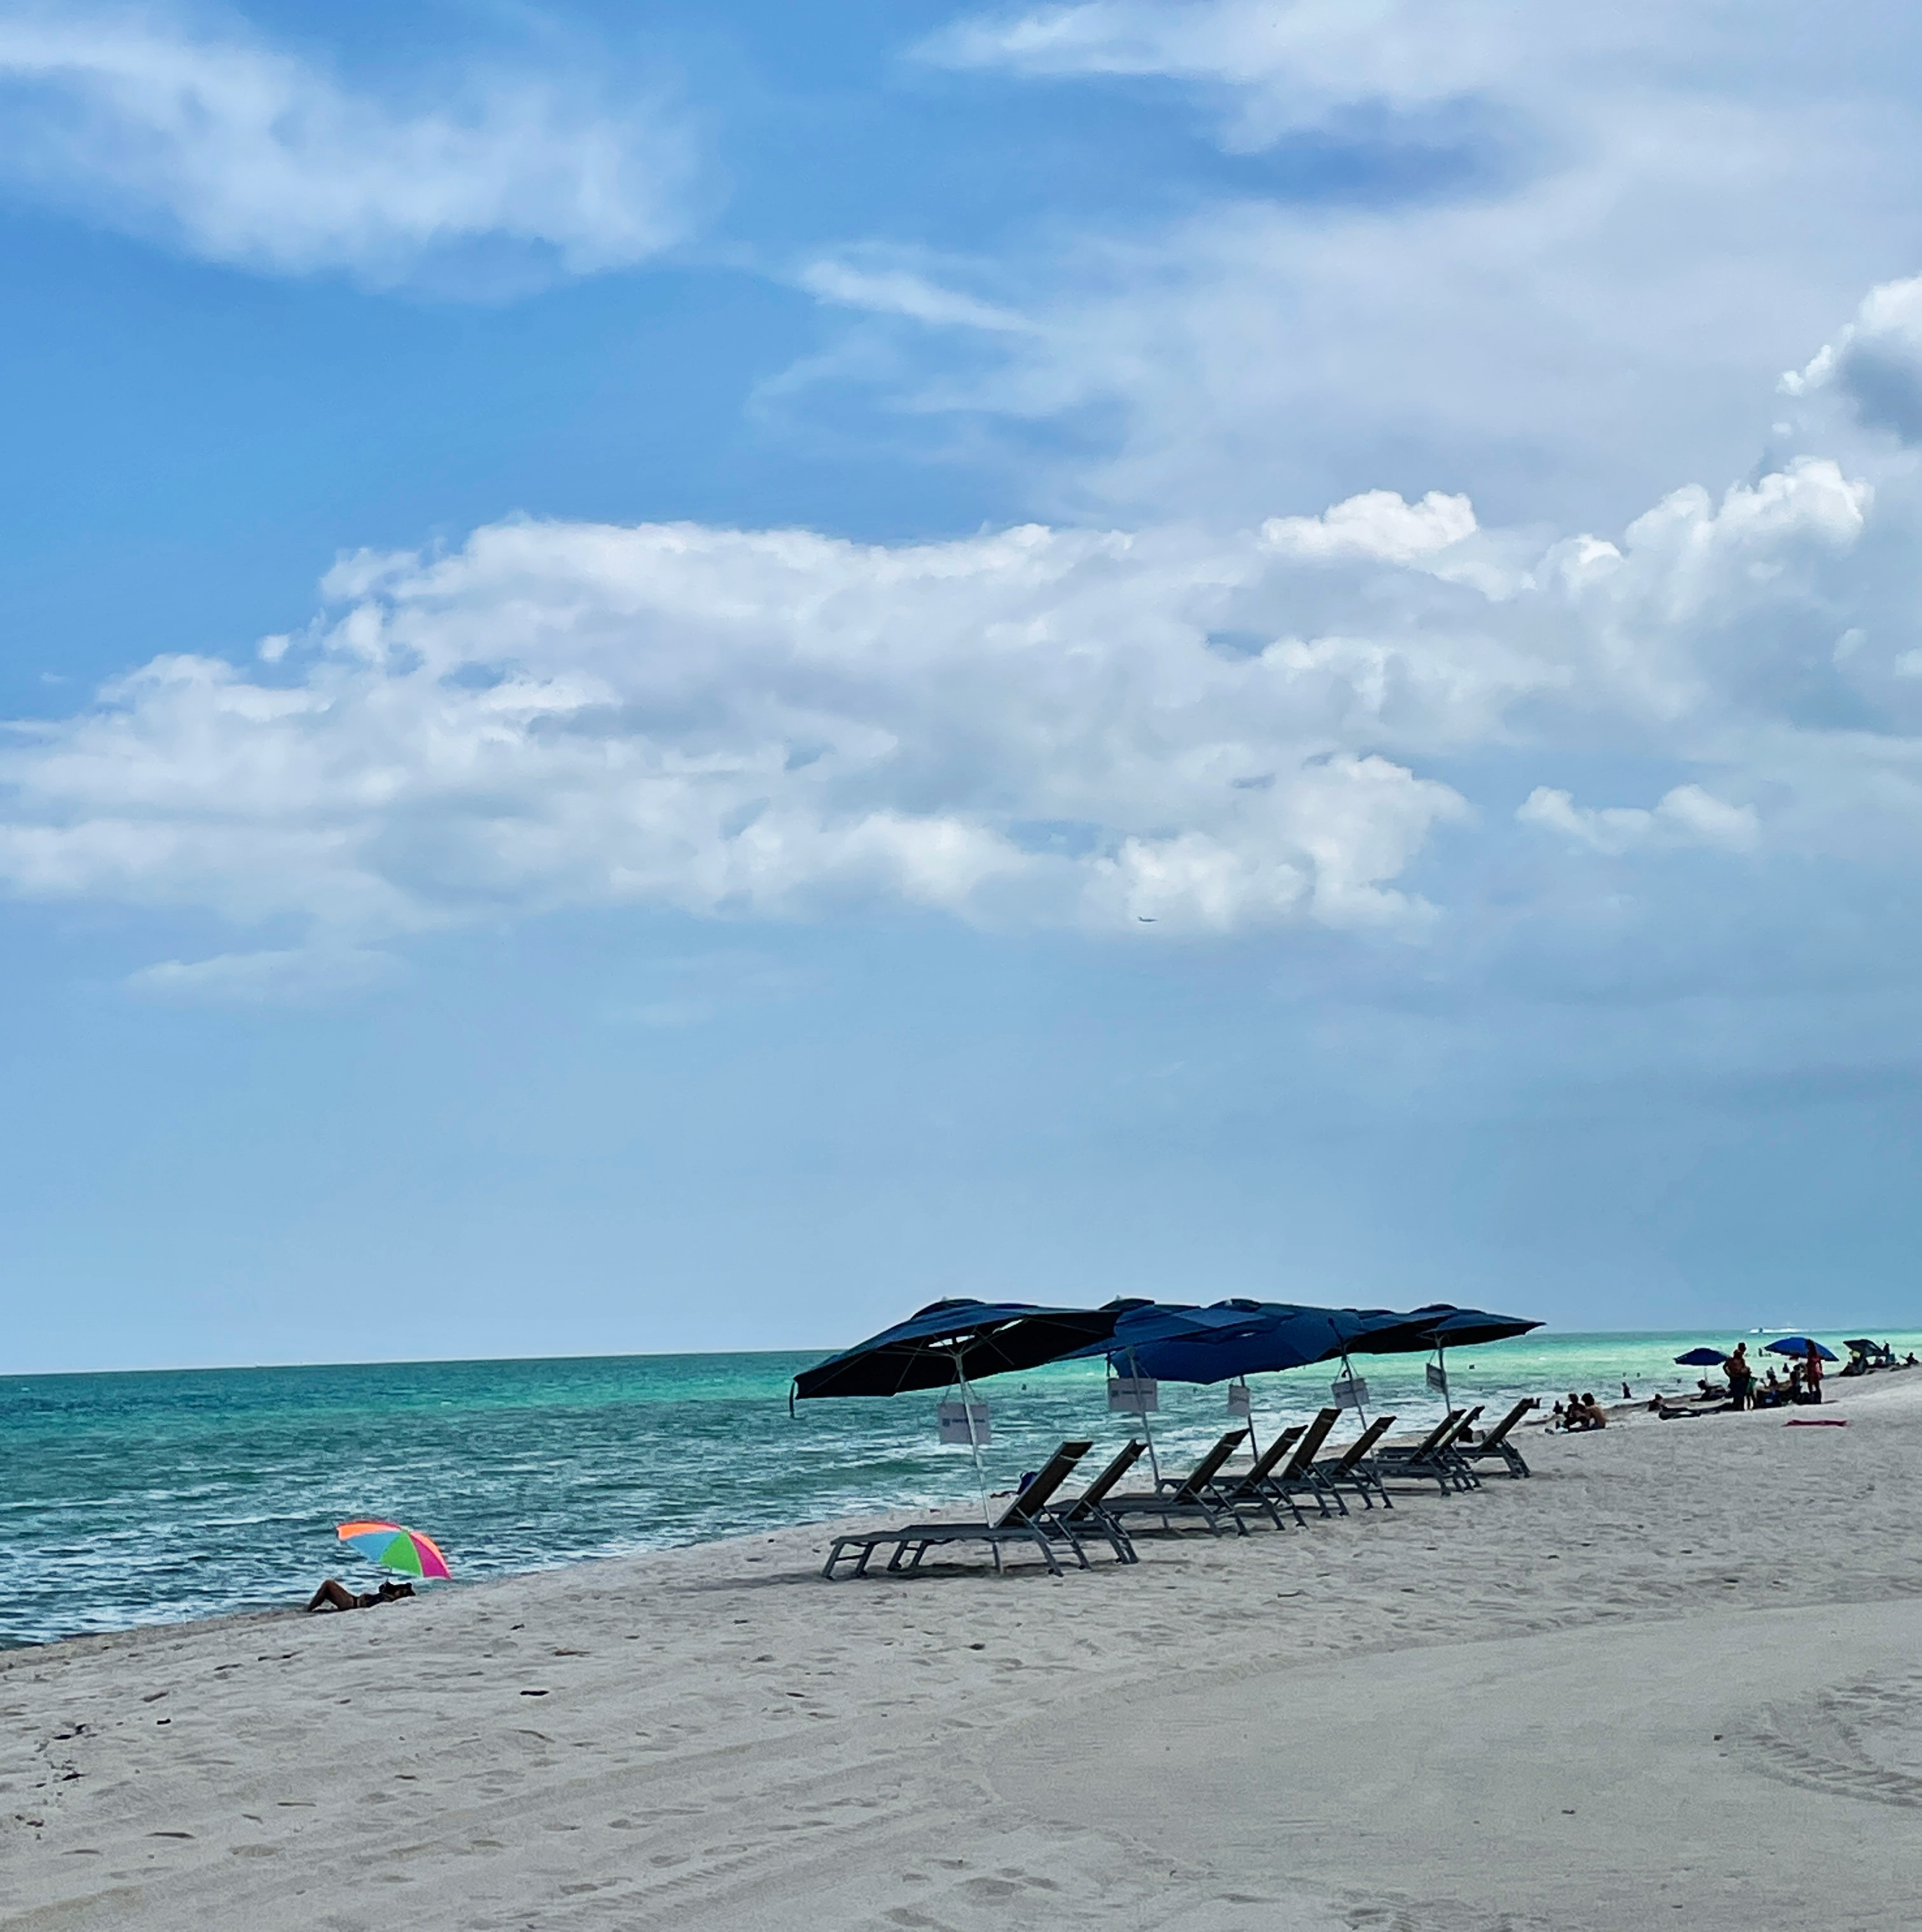
Beryl Feasted on Record-Hot Ocean
July 2024 • Tampa Bay Times
How Much It Takes to Get an Abortion in the 'PURPLE' State of Florida?
October 2022 • University of Miami
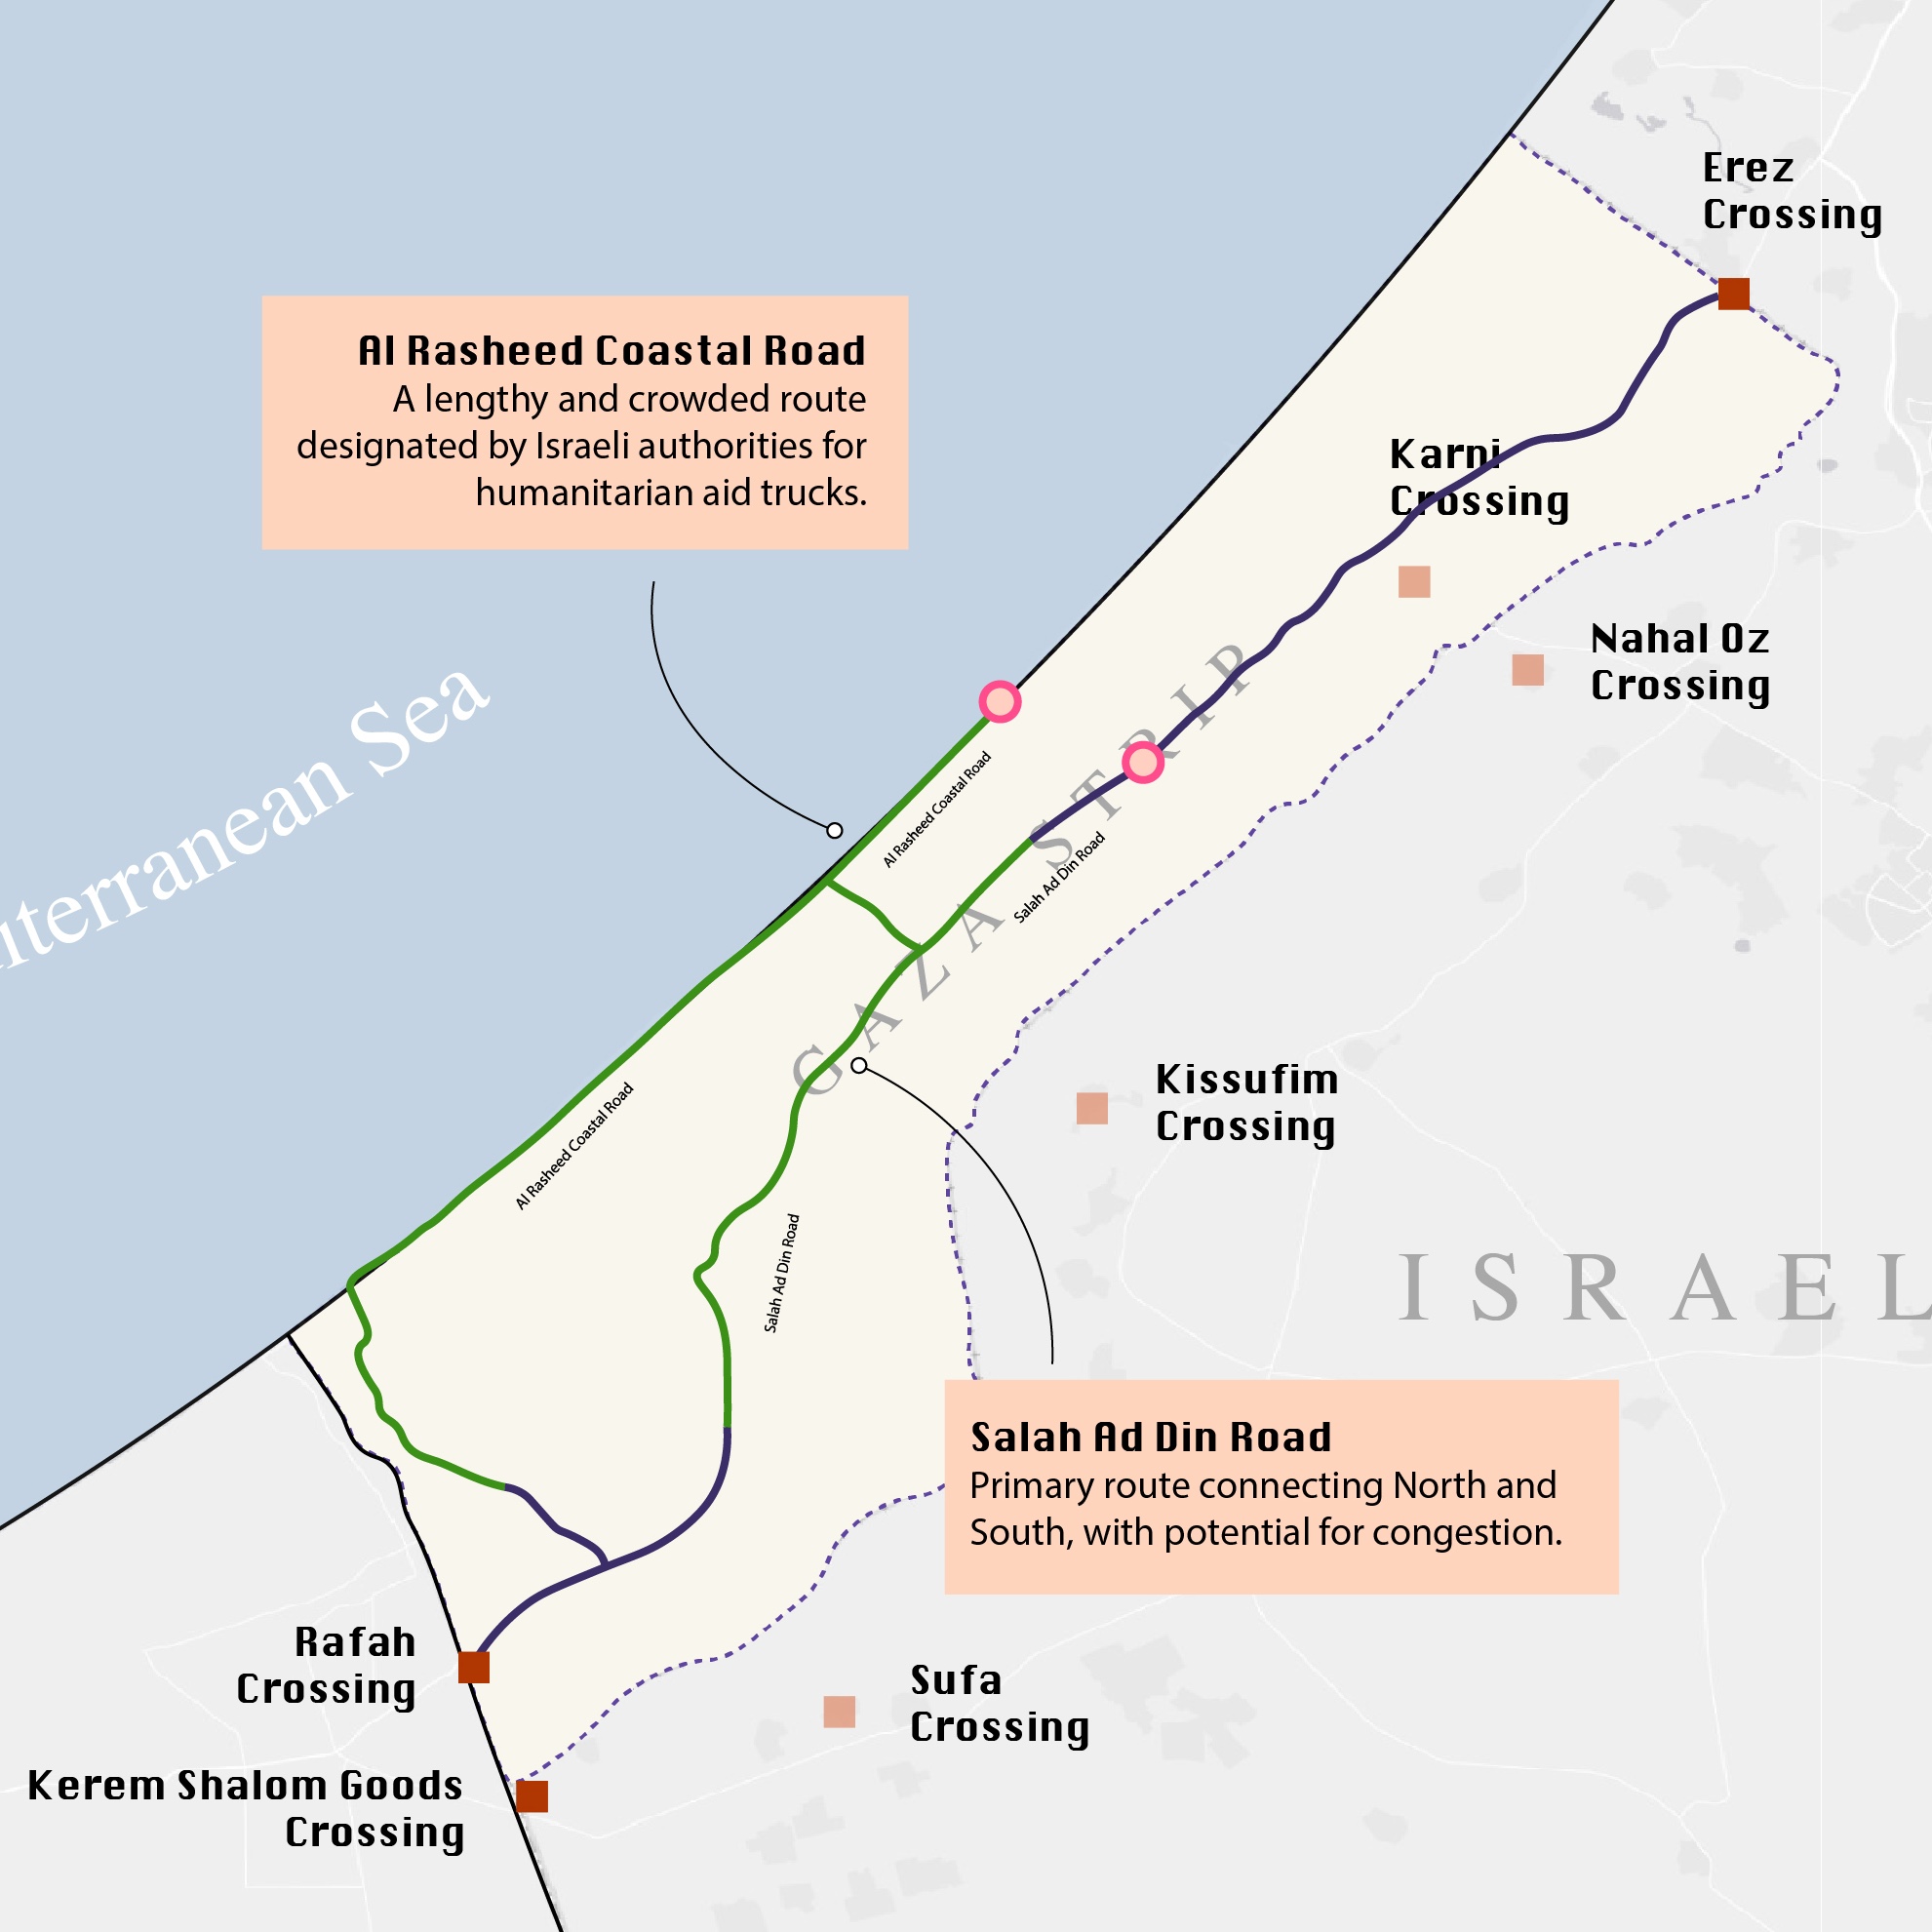
Where is Gaza's Aid?
May 2024 • Stanford University
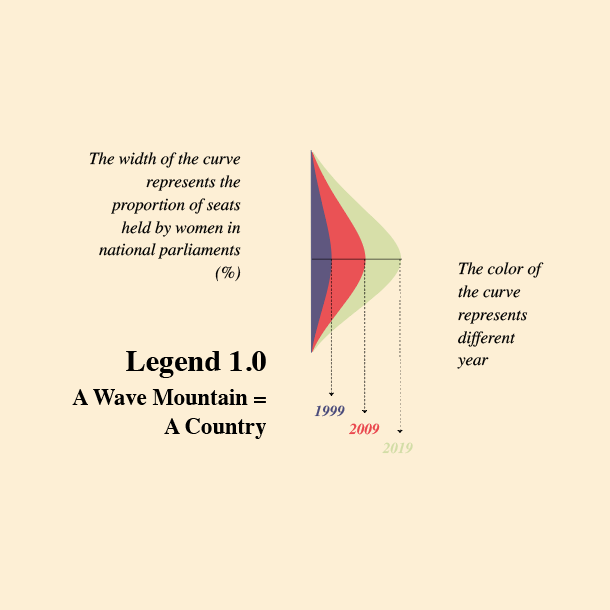
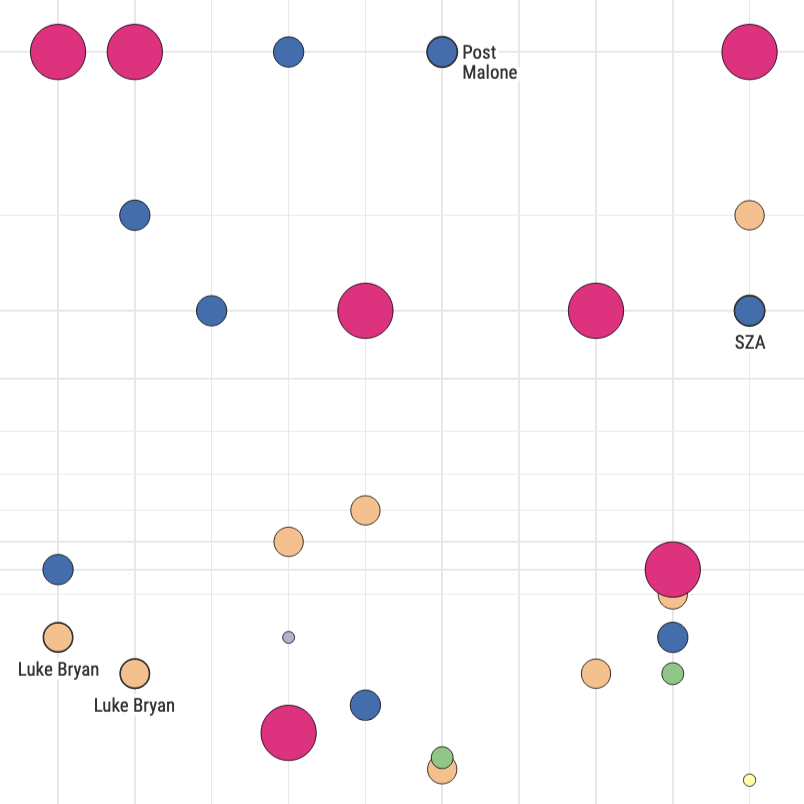
Singapore Political Gender Imbalance
April 2024 • Personal
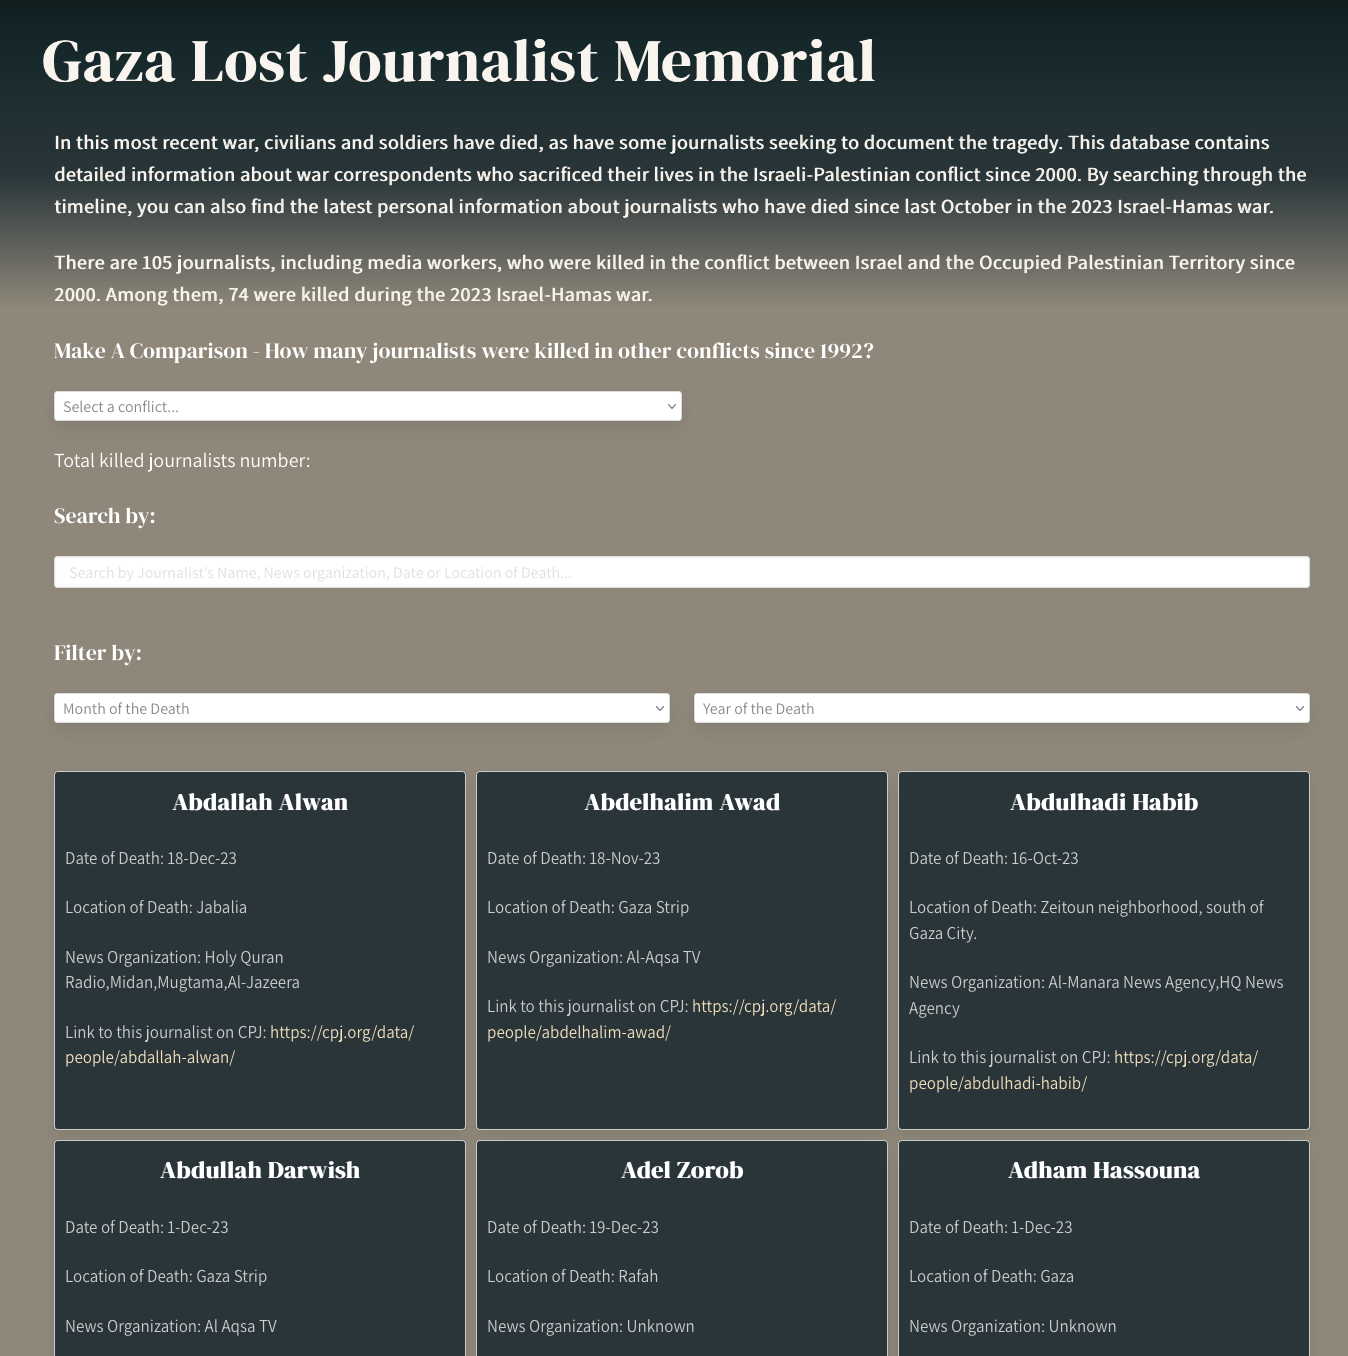
Gaza Killed Journalist Database
February 2024 • Stanford University
U.S. Prison Phone Rate
March 2023 • Personal
Why I Watched that Movie at that Time?
July 2022 • Lede Program ・ Columbia University
Who is being hunted where?
April 2022 • University of Miami
The Biggest Weapon
April 2022 • University of Miami
NEWS REPORTING
I write words

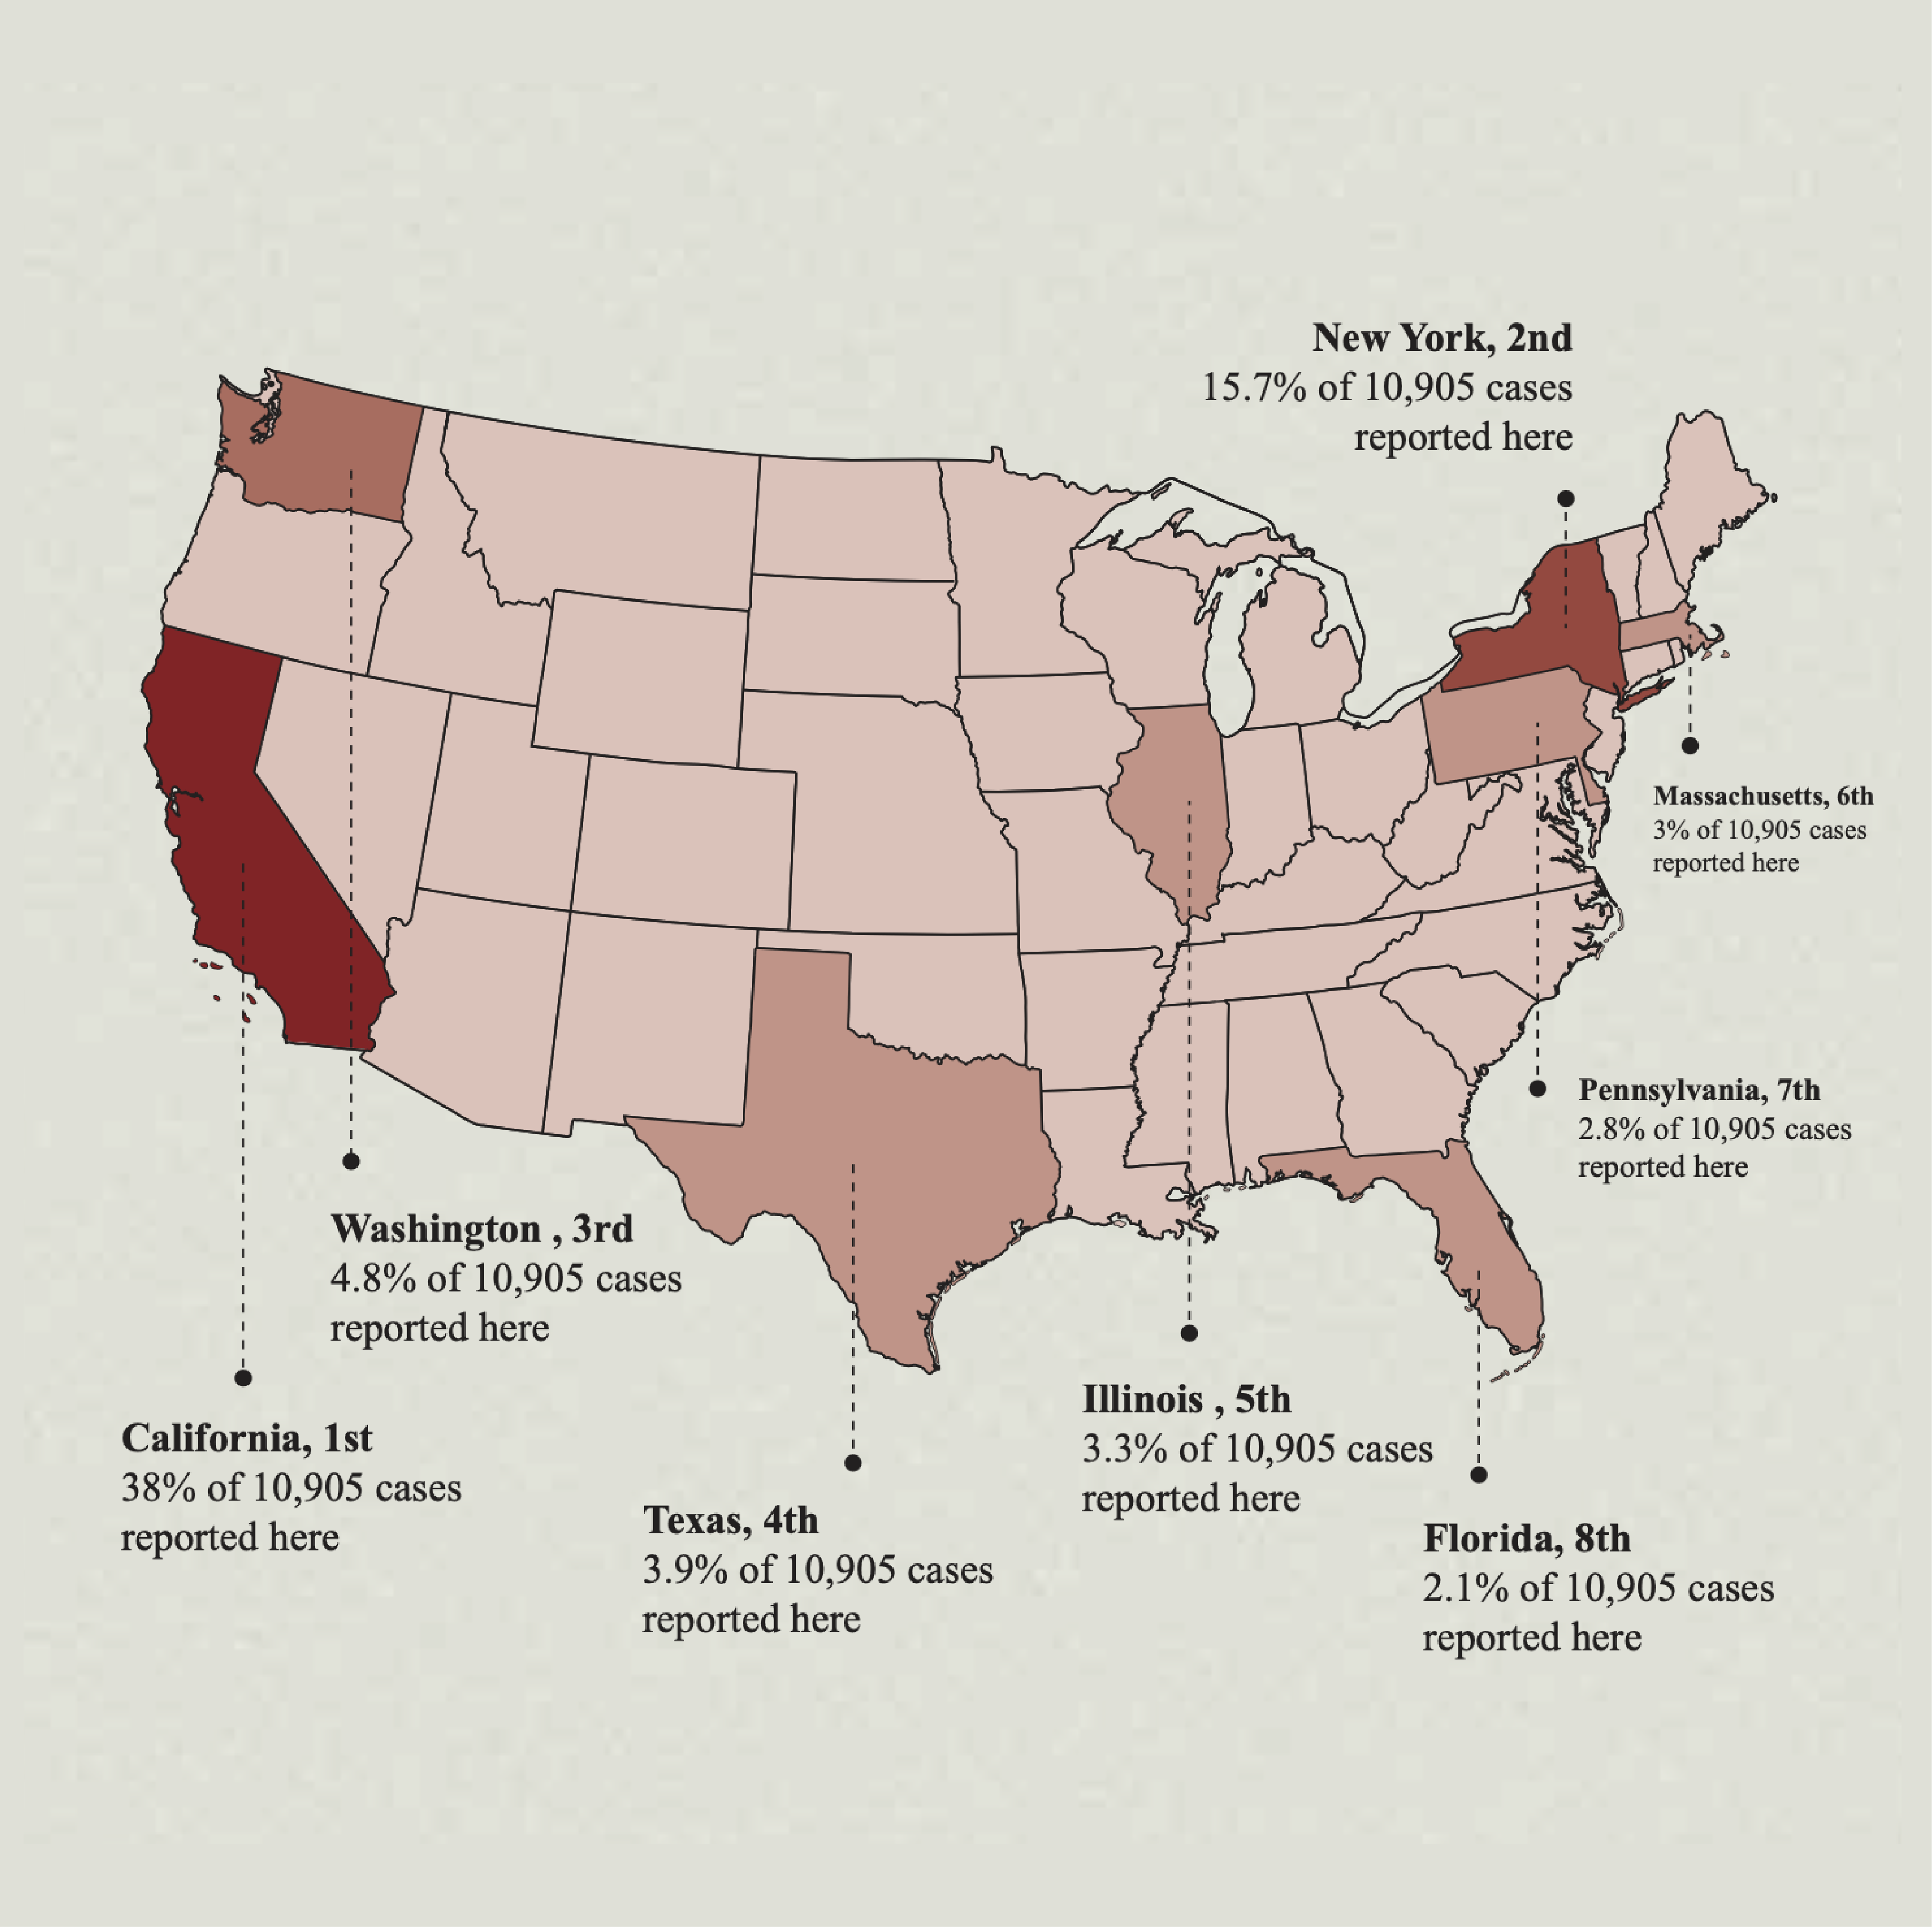
How Dark-Fleet Ships Use A Digital Trick to Disappear—And How to Find Them
Scientific American
December 2025

Four Million U.S. Children Had No Health Insurance in 2024. Some Will Die of Cancer
Scientific American
December 2025

AI Reads Your Tongue Color to Reveal Hidden Diseases
Scientific American
October 2025

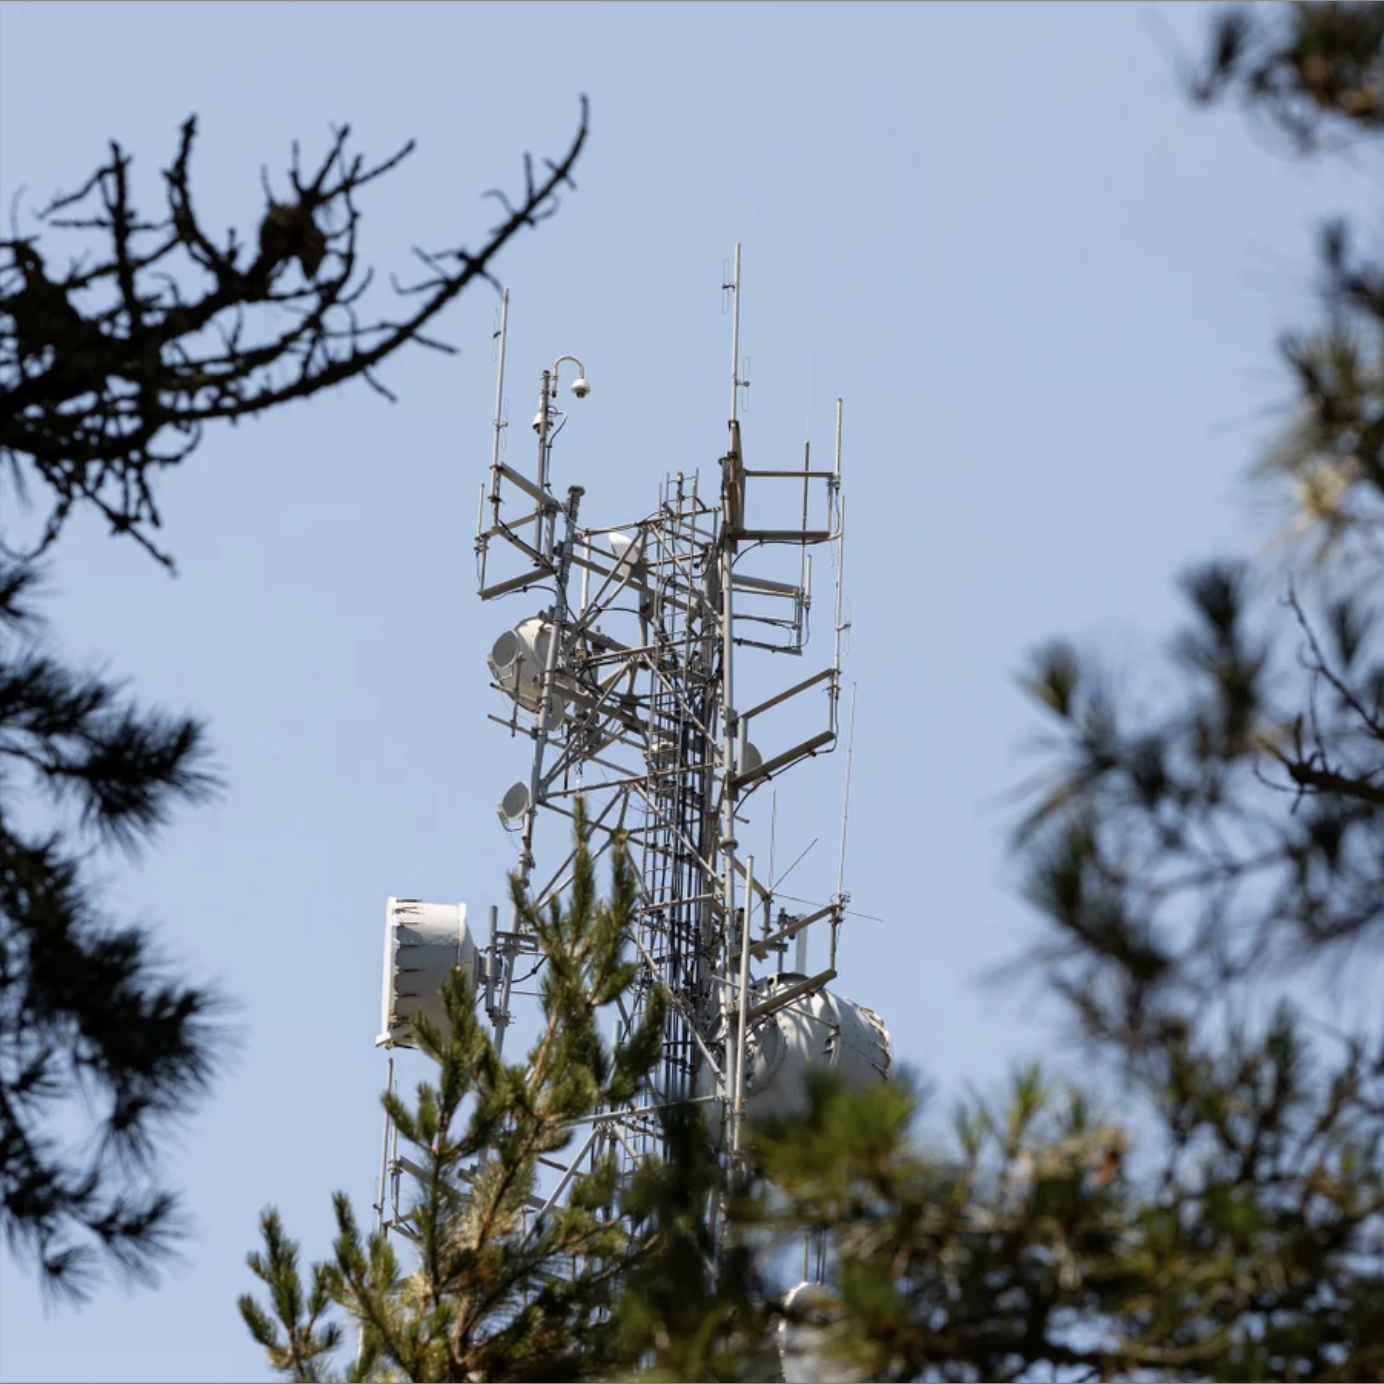
Widespread Backlash Against APEC in S.F., but Why?
San Francisco, California
December 2023
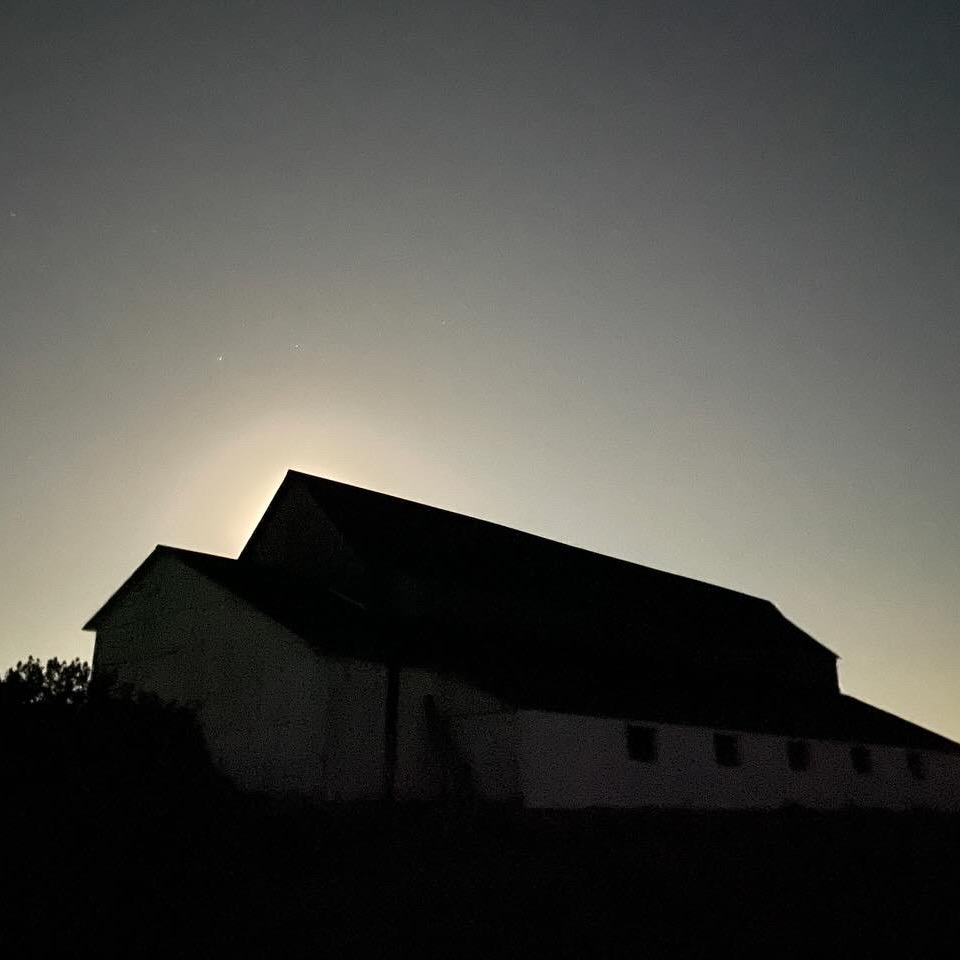
Point Reyes, California
January 9, 2024
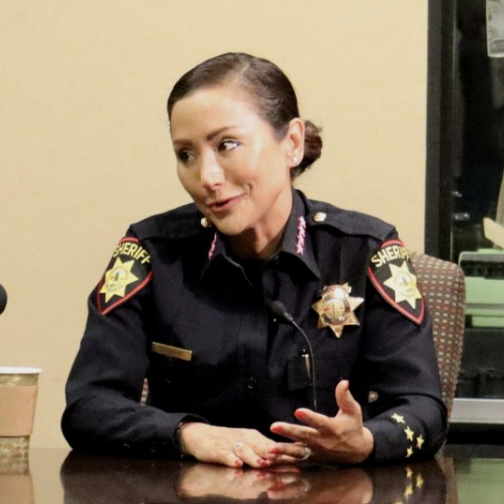
San Mateo, California
October, 2023
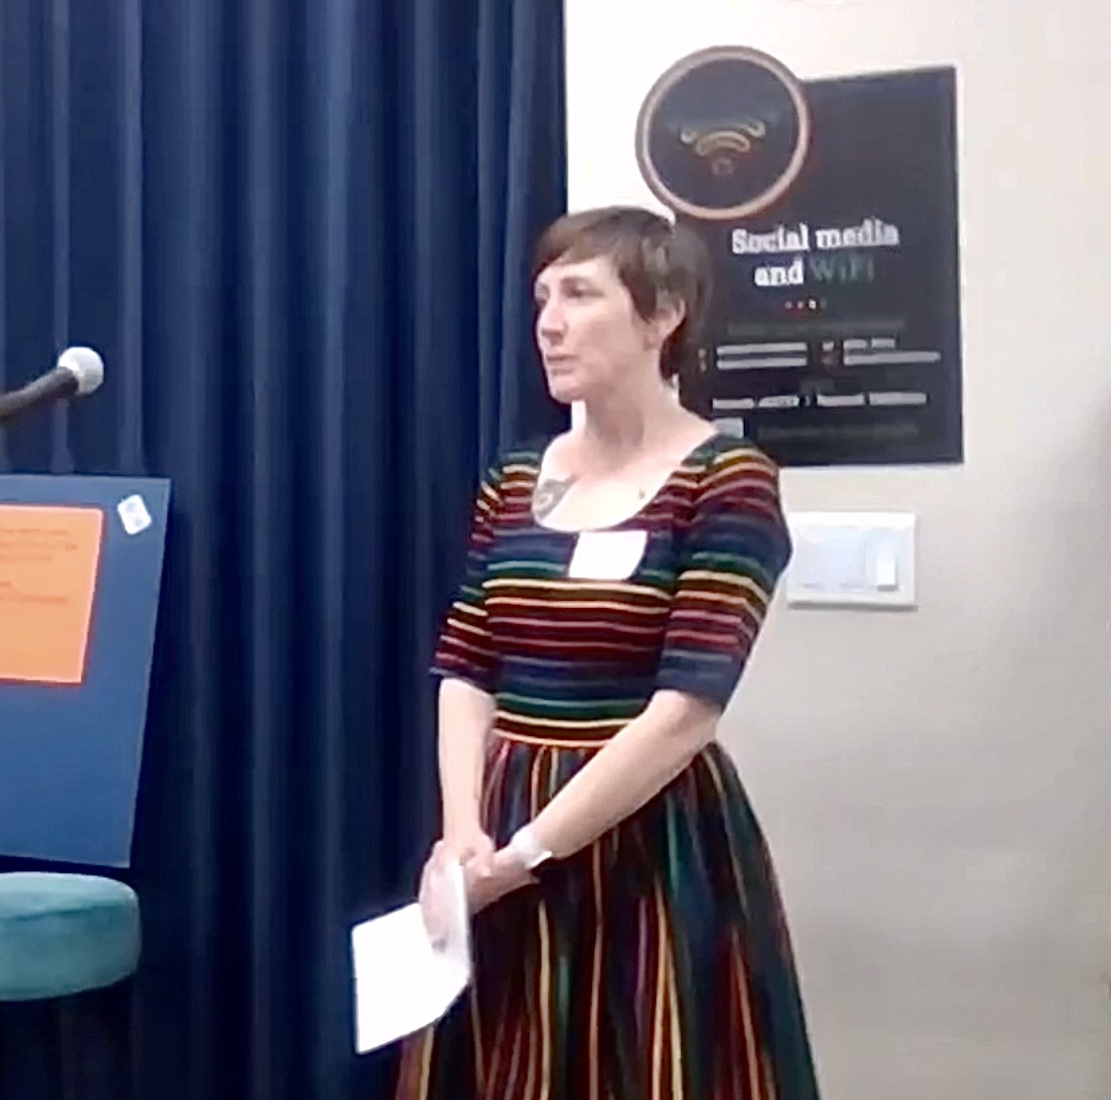
California’s Parental Notification Policy Ignites Controversy Over Trans Youth Rights
Sacramento, California
November 9, 2023
DOCUMENTARY
I produce films
ILLUSTRATION
I also draw...on my diary book!
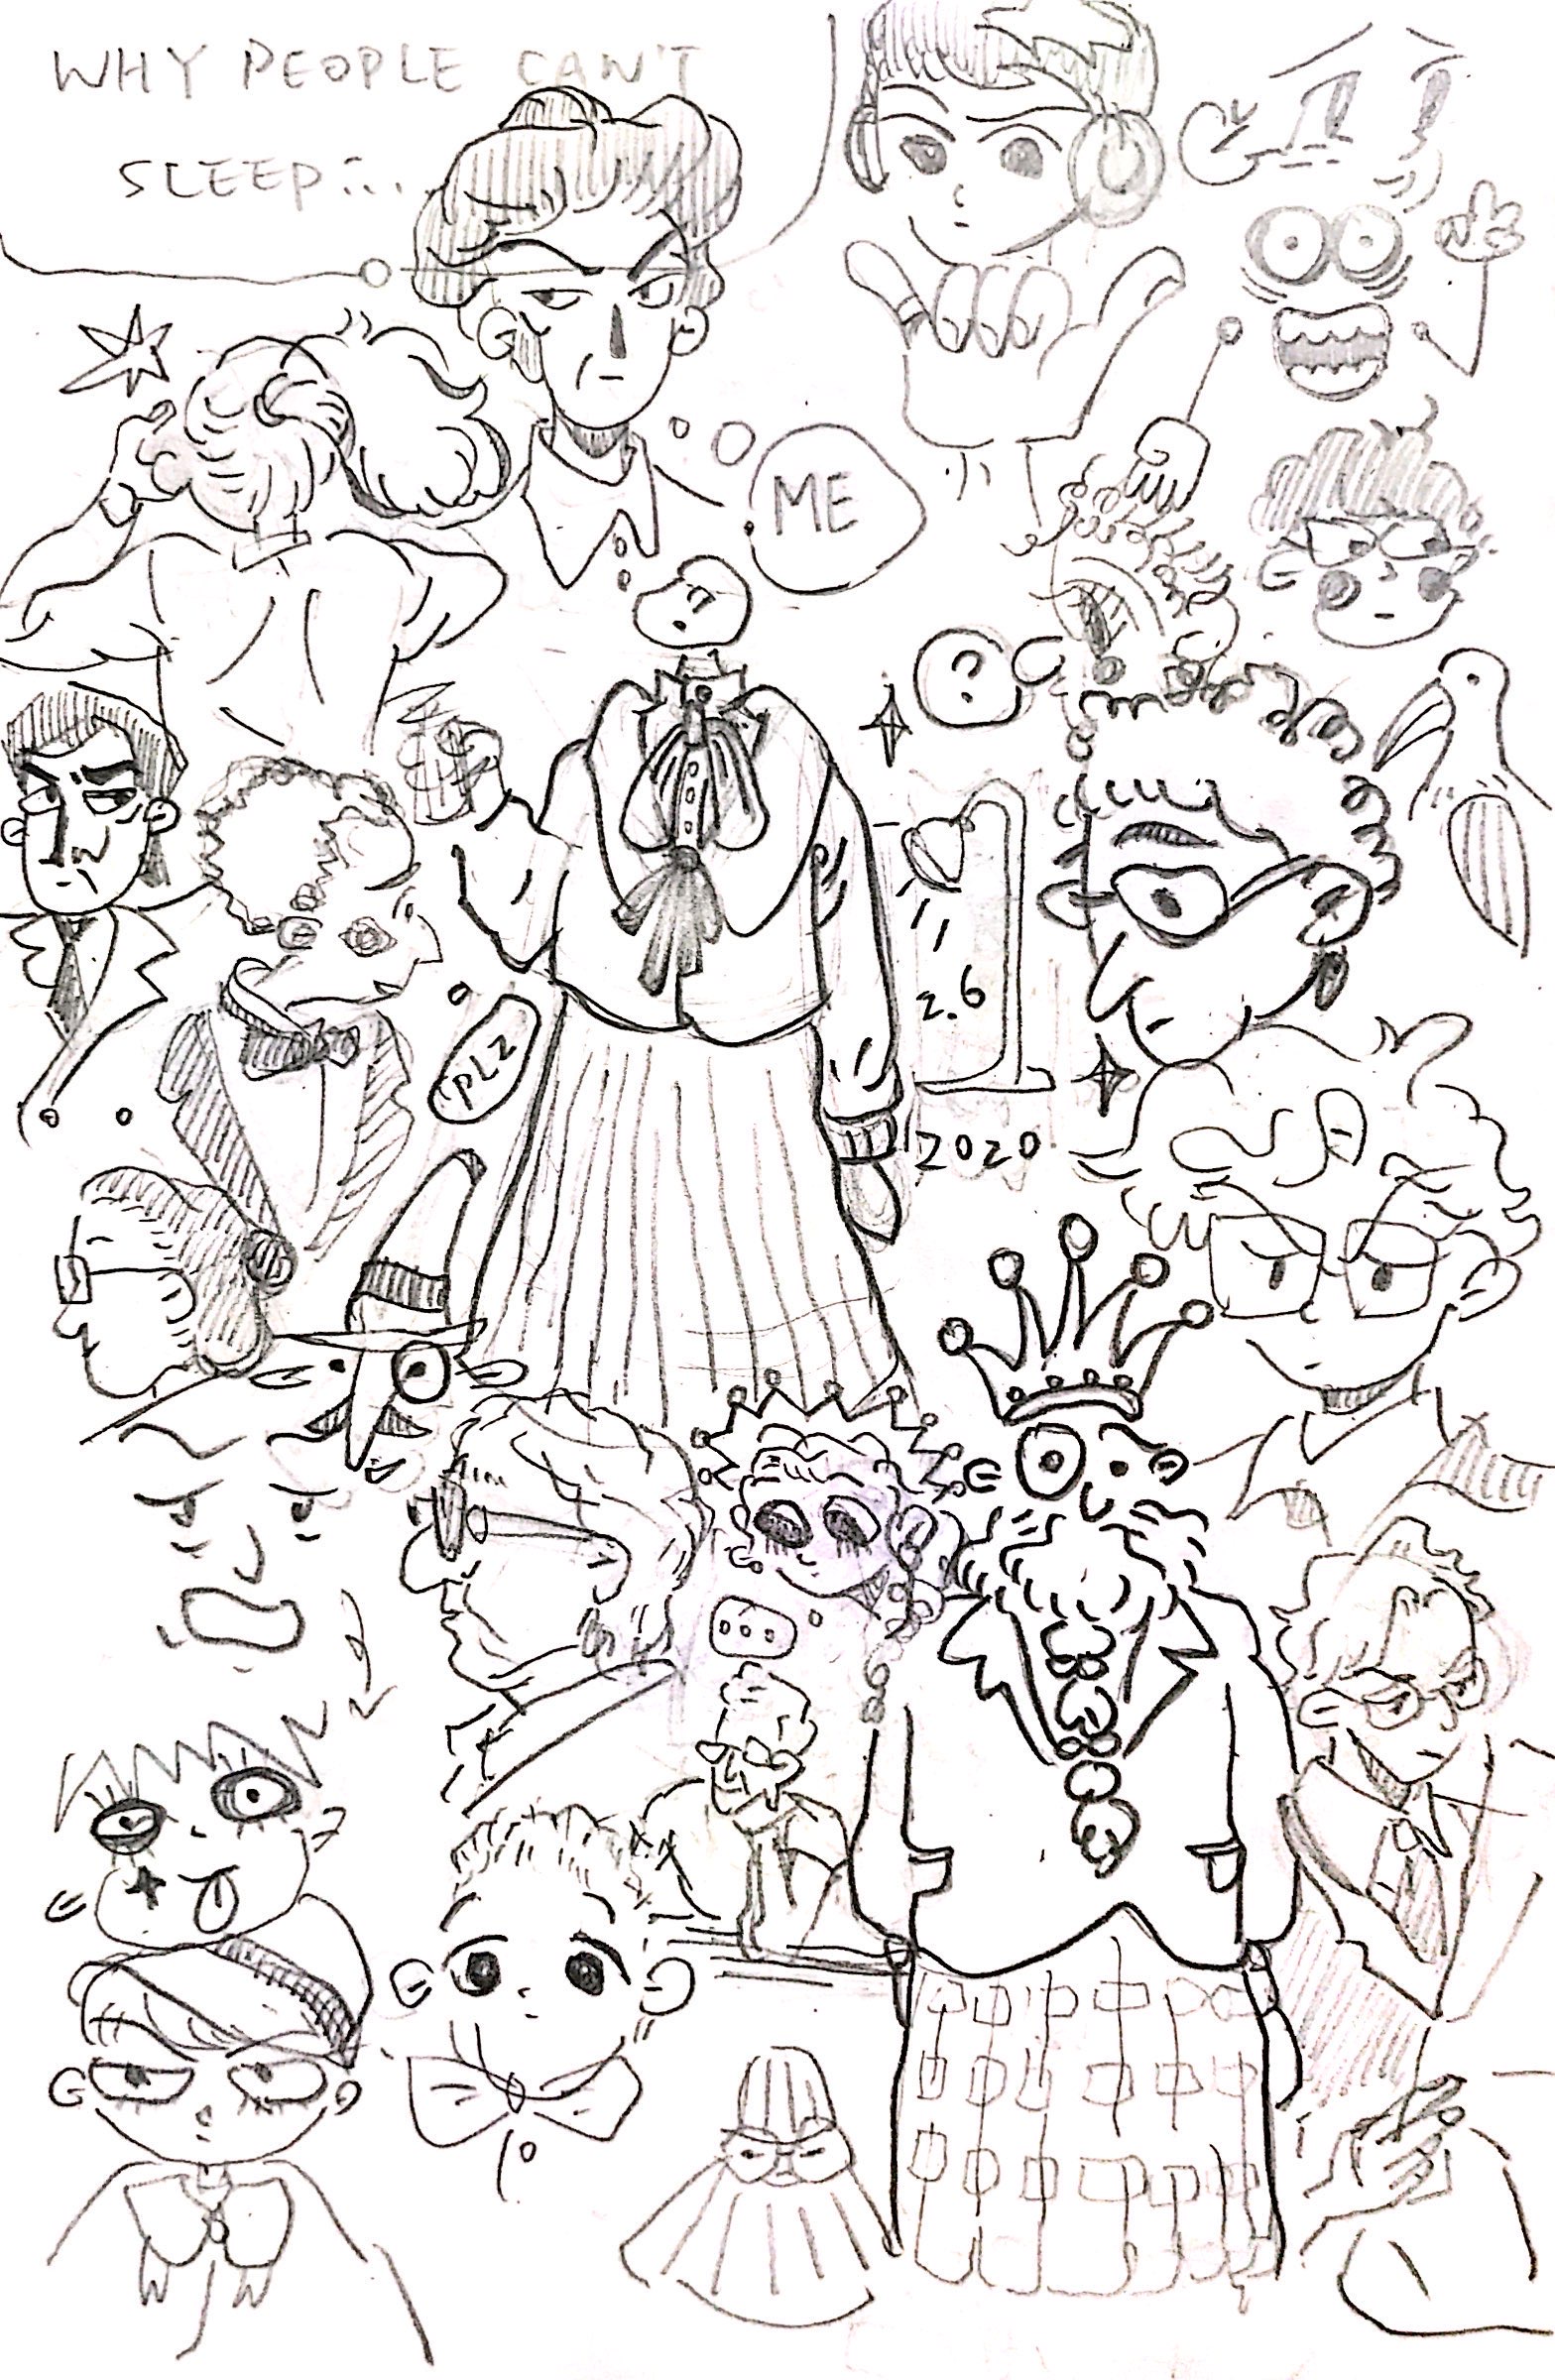
Most of my illustrations are reproductions of art found online;
I do not hold the copyright for these works.